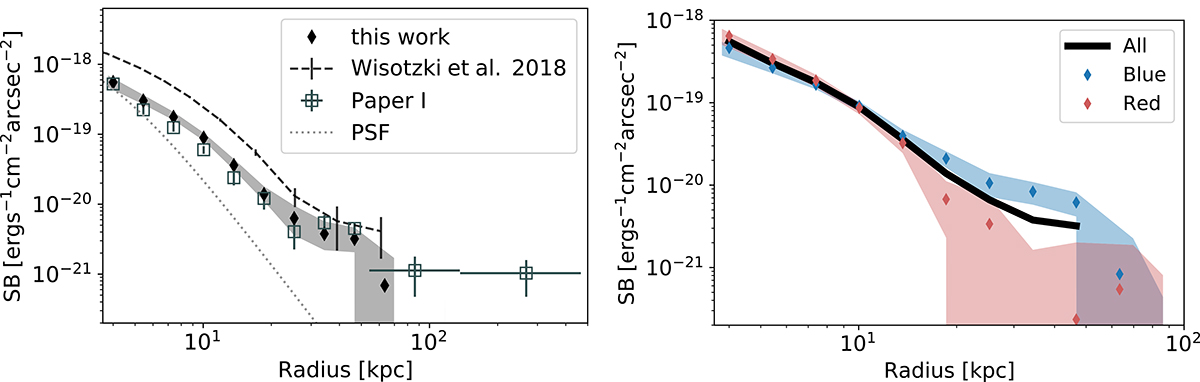
Fig. B.1.
Download original image
The Lyα surface brightness profile. Left: The black symbols show the Lyα surface brightness profile extracted within a pseudo-NB of [-600, 600] km/s, with the centroid of the pseudo-NB at the Lyα peak of the target LAE. The grey shadow indicates the error range. The open squares show the Lyα surface brightness profile in Paper I. The dashed line shows the Lyα surface brightness profile in Wisotzki et al. (2018). The grey dashed line shows the PSF profile. Right: The black curve corresponds to the black symbols in the left panel. The red and blue dots with error ranges present the Lyα surface brightness profile extracted by pseudo-NB [0, 600] km/s and [-600, 0] km/s, respectively. These two profiles are multiplied by a factor of 2 for better visualisation.
Current usage metrics show cumulative count of Article Views (full-text article views including HTML views, PDF and ePub downloads, according to the available data) and Abstracts Views on Vision4Press platform.
Data correspond to usage on the plateform after 2015. The current usage metrics is available 48-96 hours after online publication and is updated daily on week days.
Initial download of the metrics may take a while.