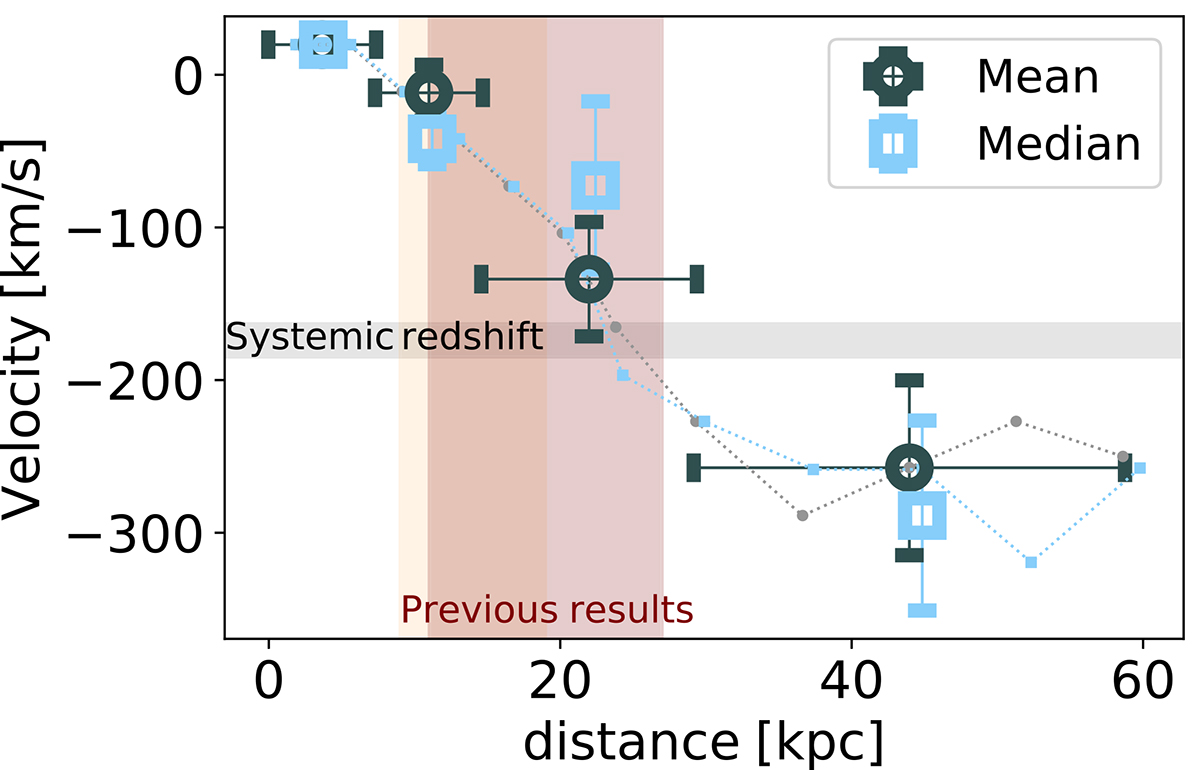
Fig. 4.
Download original image
Radial evolution of the Lyα peak velocity with respect to the Lyα line of the central LAE. The open circles and squares show the Lyα peak velocity shift in the mean and median stacks (Figure 2). The small symbols connected by dotted lines show the same results extracted with smaller radial bins. The grey horizontal shadow shows the median systemic redshift of the central LAE, as is shown in Figure 3, based on the empirical relations established by Verhamme et al. (2018). The orange and maroon vertical shadows show the maximum radii of the LAHs from previous MUSE (Leclercq et al. 2020; Claeyssens et al. 2019) and KCWI (Erb et al. 2018, 2023) analysis.
Current usage metrics show cumulative count of Article Views (full-text article views including HTML views, PDF and ePub downloads, according to the available data) and Abstracts Views on Vision4Press platform.
Data correspond to usage on the plateform after 2015. The current usage metrics is available 48-96 hours after online publication and is updated daily on week days.
Initial download of the metrics may take a while.