Fig. 8
Download original image
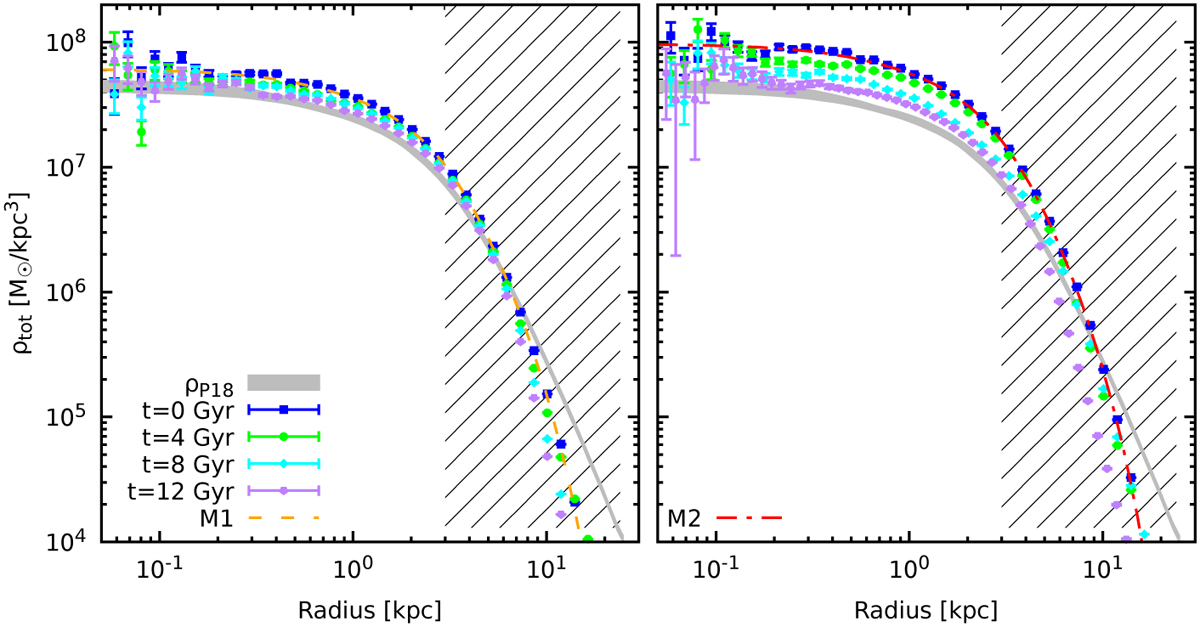
Evolution of the total density profile over 12 Gyr in simulations S1 (left) and S2 (right). The symbols have the same meaning as in Fig. 2. The red and yellow dashed lines mark the initial profiles (models M1 and M2). The gray shaded area is the present-day total density profile of the Fornax dSph estimated by Pascale et al. (2018) with its 1-σ uncertainty. The hatched parts of the graphs indicate regions where the total mass distribution of the Fornax dSph is poorly constrained, because there are no luminous tracers of the gravitational potential.
Current usage metrics show cumulative count of Article Views (full-text article views including HTML views, PDF and ePub downloads, according to the available data) and Abstracts Views on Vision4Press platform.
Data correspond to usage on the plateform after 2015. The current usage metrics is available 48-96 hours after online publication and is updated daily on week days.
Initial download of the metrics may take a while.