Fig. 6
Download original image
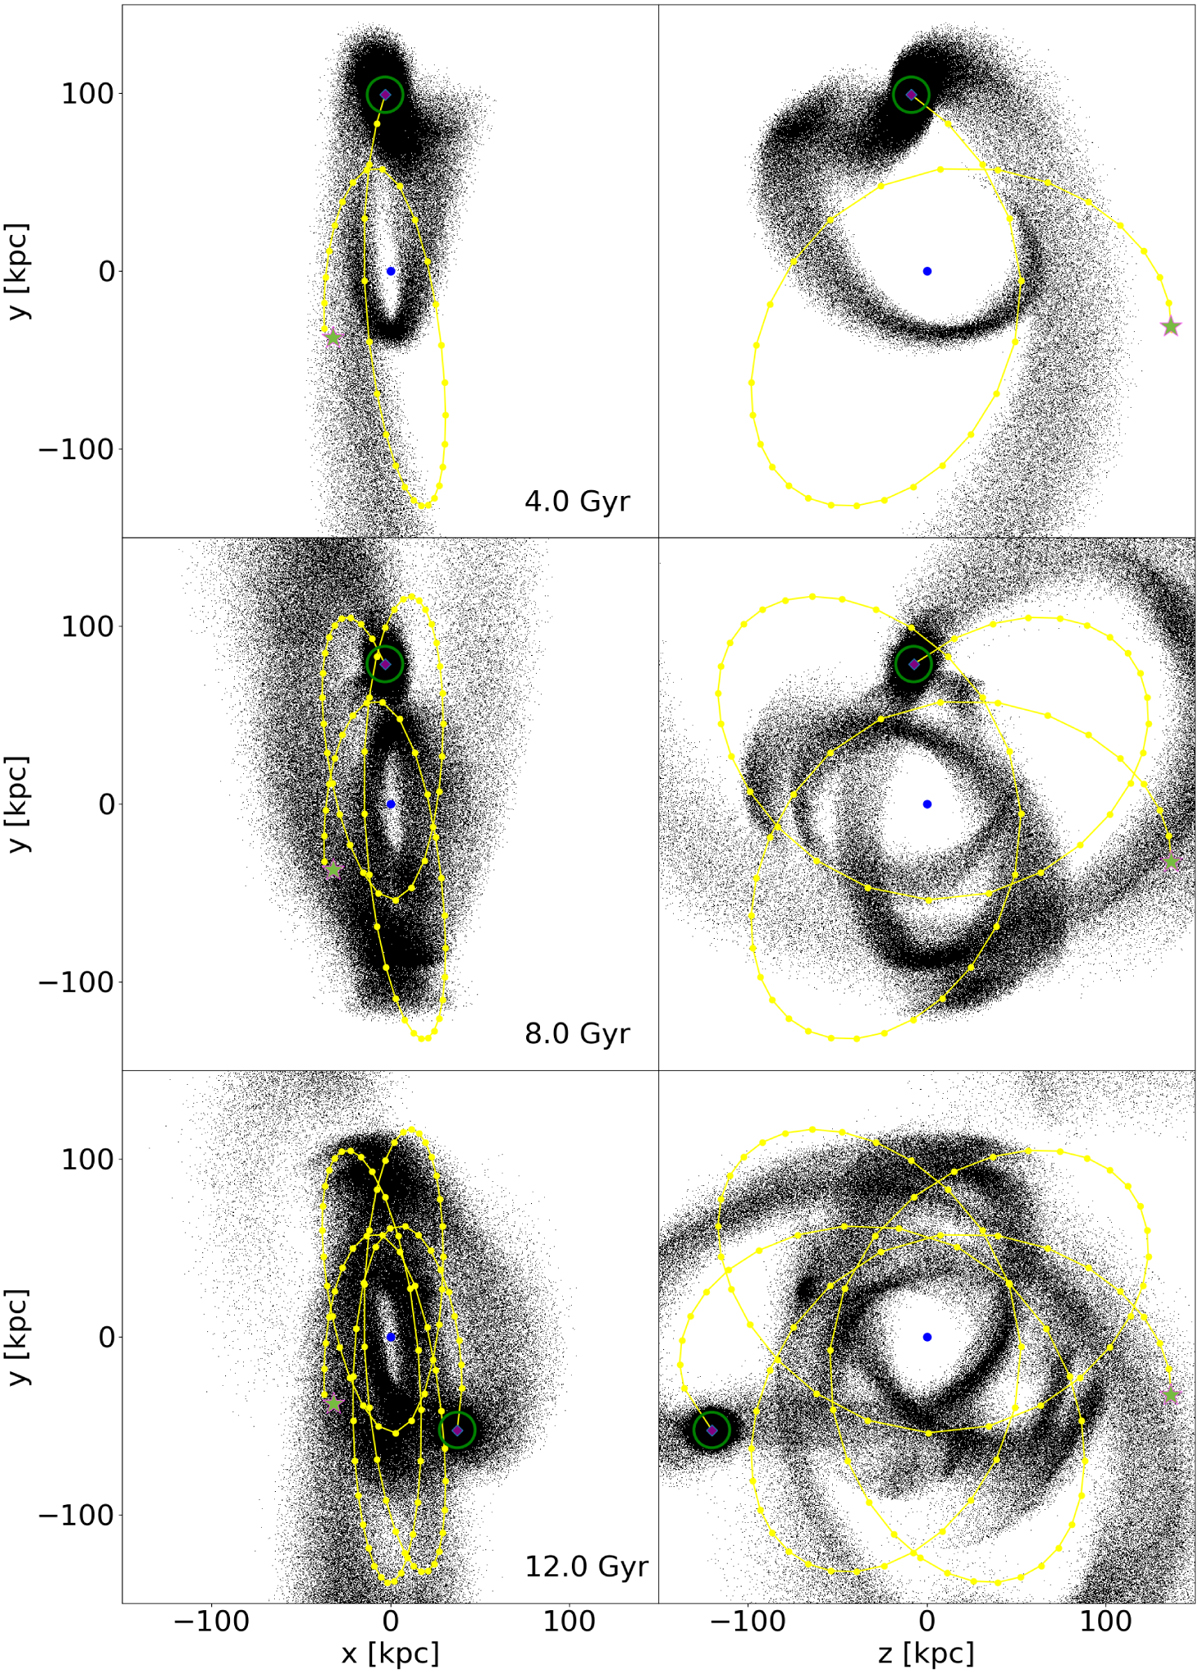
Spatial distribution of the particles of the satellite in the x-y and z-y planes at t = 4, 8 and 12 Gyr for the S1 simulation. Green star: initial position of the satellite’s centre. Dotted lines: trajectory of the satellite’s centre. Blue dot: centre of the MW model. Green circle: 10 kpc radius circumference centred in the satellite’s centre at the time of the snapshot. Here the particles represent the total (stars plus DM) mass distribution.
Current usage metrics show cumulative count of Article Views (full-text article views including HTML views, PDF and ePub downloads, according to the available data) and Abstracts Views on Vision4Press platform.
Data correspond to usage on the plateform after 2015. The current usage metrics is available 48-96 hours after online publication and is updated daily on week days.
Initial download of the metrics may take a while.