Open Access
Fig. 5
Download original image
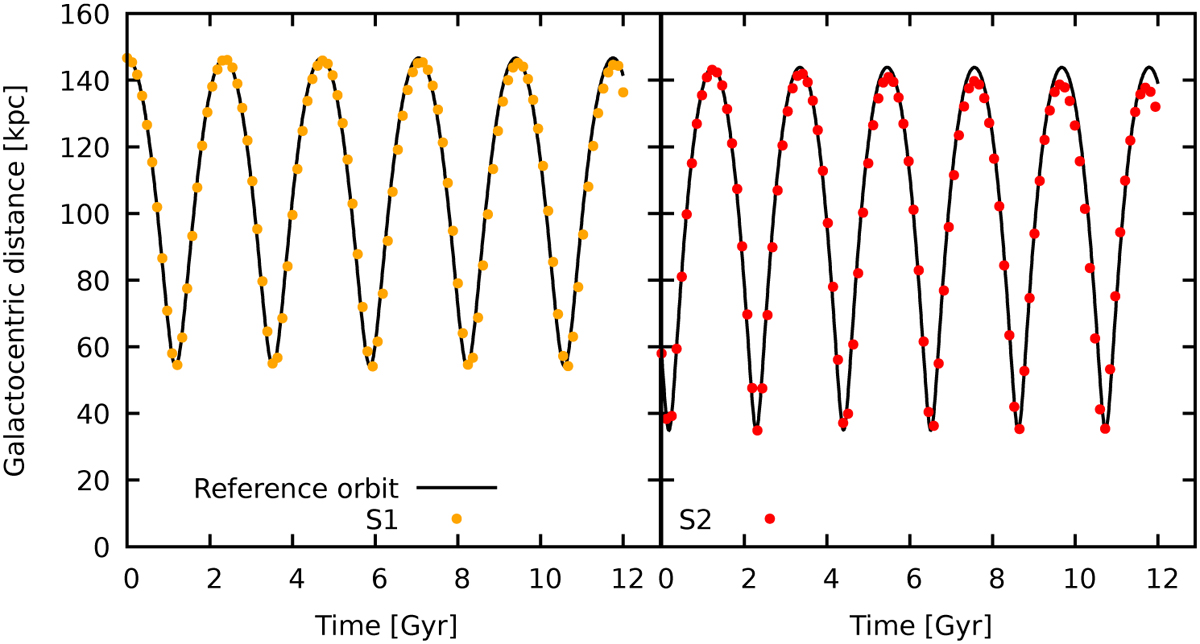
Galactocentric distance of the satellite’s centre as function of time for simulations S1 (left) and S2 (right), respectively. The solid lines mark the trajectory of a point-mass particle with the same initial conditions as the c.o.m. of the satellite in the two simulations.
Current usage metrics show cumulative count of Article Views (full-text article views including HTML views, PDF and ePub downloads, according to the available data) and Abstracts Views on Vision4Press platform.
Data correspond to usage on the plateform after 2015. The current usage metrics is available 48-96 hours after online publication and is updated daily on week days.
Initial download of the metrics may take a while.