Fig. 4
Download original image
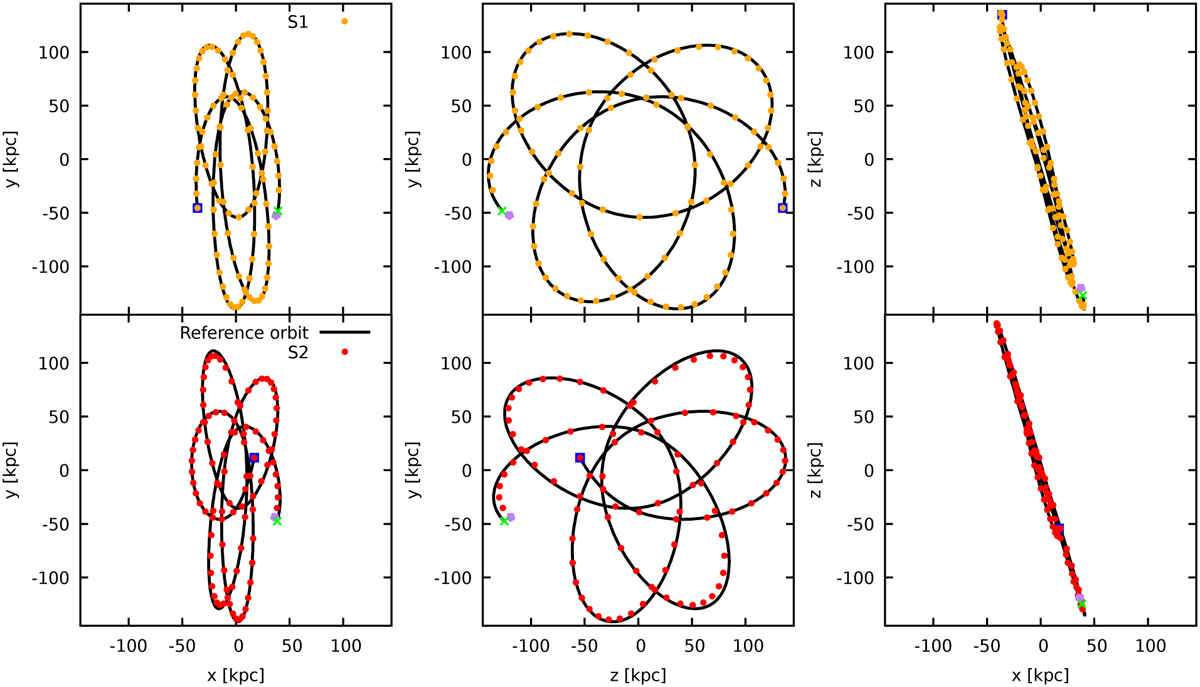
x-y, z-y and x-z projections of Fornax-like O1 (upper panels) and O2 (lower panels) orbits of a point-like mass in the J95 potential (solid lines), and of the trajectories of the satellite’s centre in the corresponding S1 and S2 simulations (yellow and red dots, respectively). The phase-space coordinates of the initial conditions (blue squares) are given in Table 2. The green crosses indicate the observationally determined present-day position of Fornax, which coincides, by construction, with the end point of the reference point-mass orbits. The purple pentagons mark the present-day position of the centre of the satellite in the N-body simulations.
Current usage metrics show cumulative count of Article Views (full-text article views including HTML views, PDF and ePub downloads, according to the available data) and Abstracts Views on Vision4Press platform.
Data correspond to usage on the plateform after 2015. The current usage metrics is available 48-96 hours after online publication and is updated daily on week days.
Initial download of the metrics may take a while.