Fig. 3
Download original image
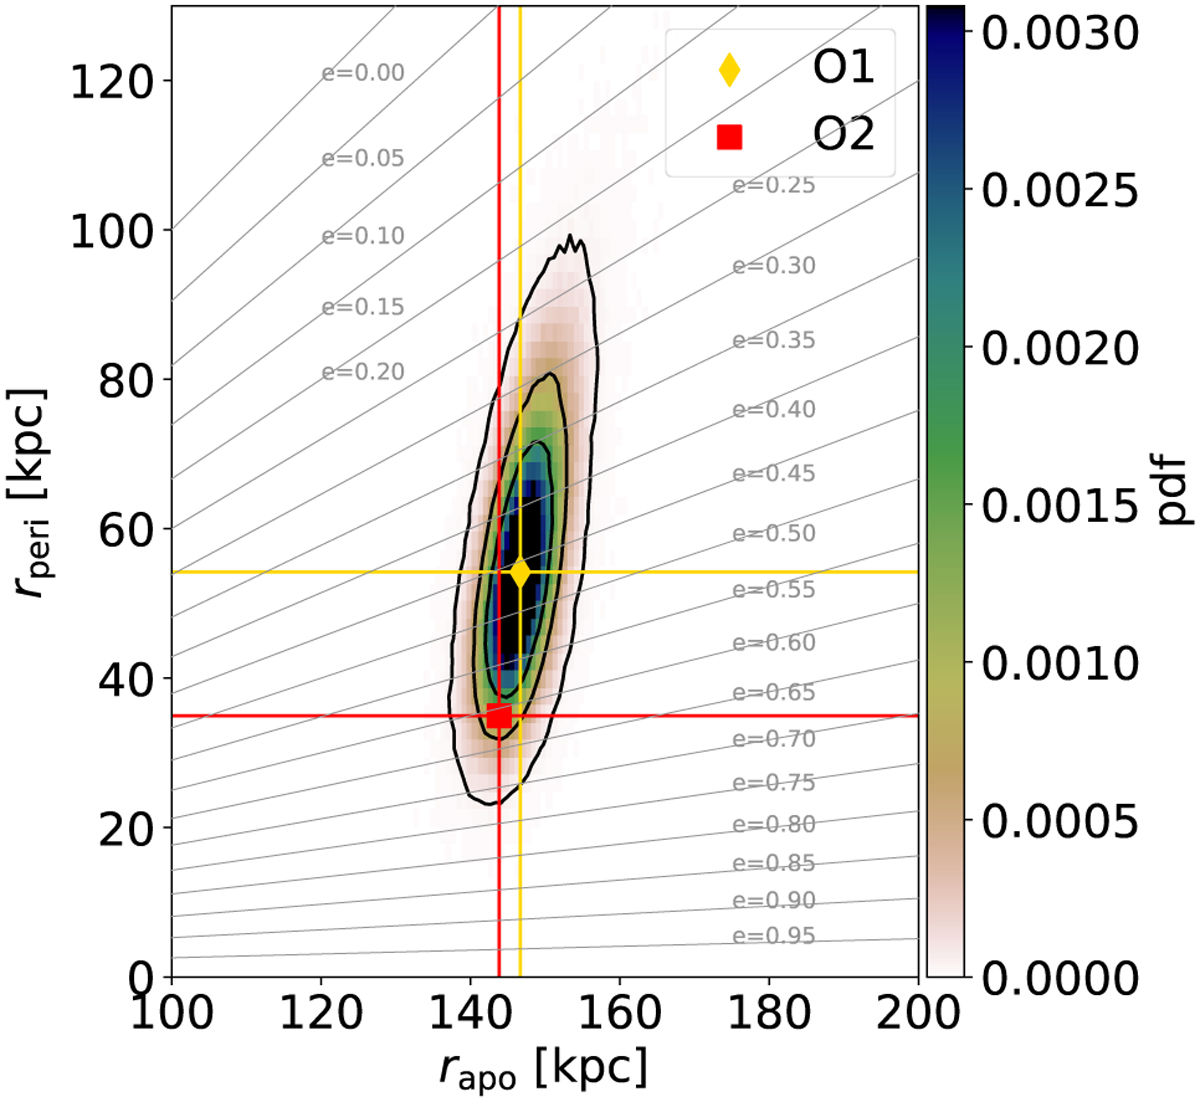
Distribution of Fornax apocentric and pericentric radii from the orbit integration (colour map). The contour levels (thick solid lines) show the area containing the 39%, 86% and 99% of the distribution (corresponding to 2-σ and 3-σ of a 2D Gaussian). The oblique grey lines indicate orbits of a given eccentricity ranging from e = 0 to e = 0.95 with a step δe = 0.05.
Current usage metrics show cumulative count of Article Views (full-text article views including HTML views, PDF and ePub downloads, according to the available data) and Abstracts Views on Vision4Press platform.
Data correspond to usage on the plateform after 2015. The current usage metrics is available 48-96 hours after online publication and is updated daily on week days.
Initial download of the metrics may take a while.