Open Access
Fig. 10
Download original image
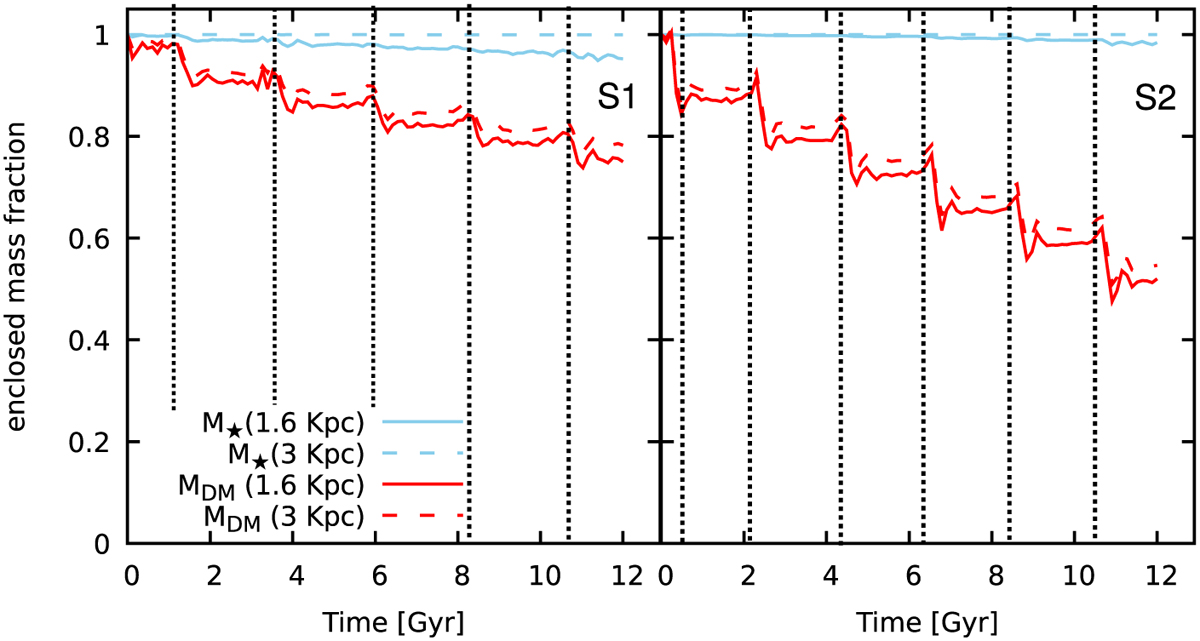
Evolution of the stellar (red lines) and DM (cyan lines) mass fractions of the satellite enclosed within spheres of radius of 1.6 (solid lines) and 3 kpc (dashed lines) for the simulations S1 (left) and S2 (right). The vertical dashed lines mark the times of the passages at the pericentre.
Current usage metrics show cumulative count of Article Views (full-text article views including HTML views, PDF and ePub downloads, according to the available data) and Abstracts Views on Vision4Press platform.
Data correspond to usage on the plateform after 2015. The current usage metrics is available 48-96 hours after online publication and is updated daily on week days.
Initial download of the metrics may take a while.