Fig. 8
Download original image
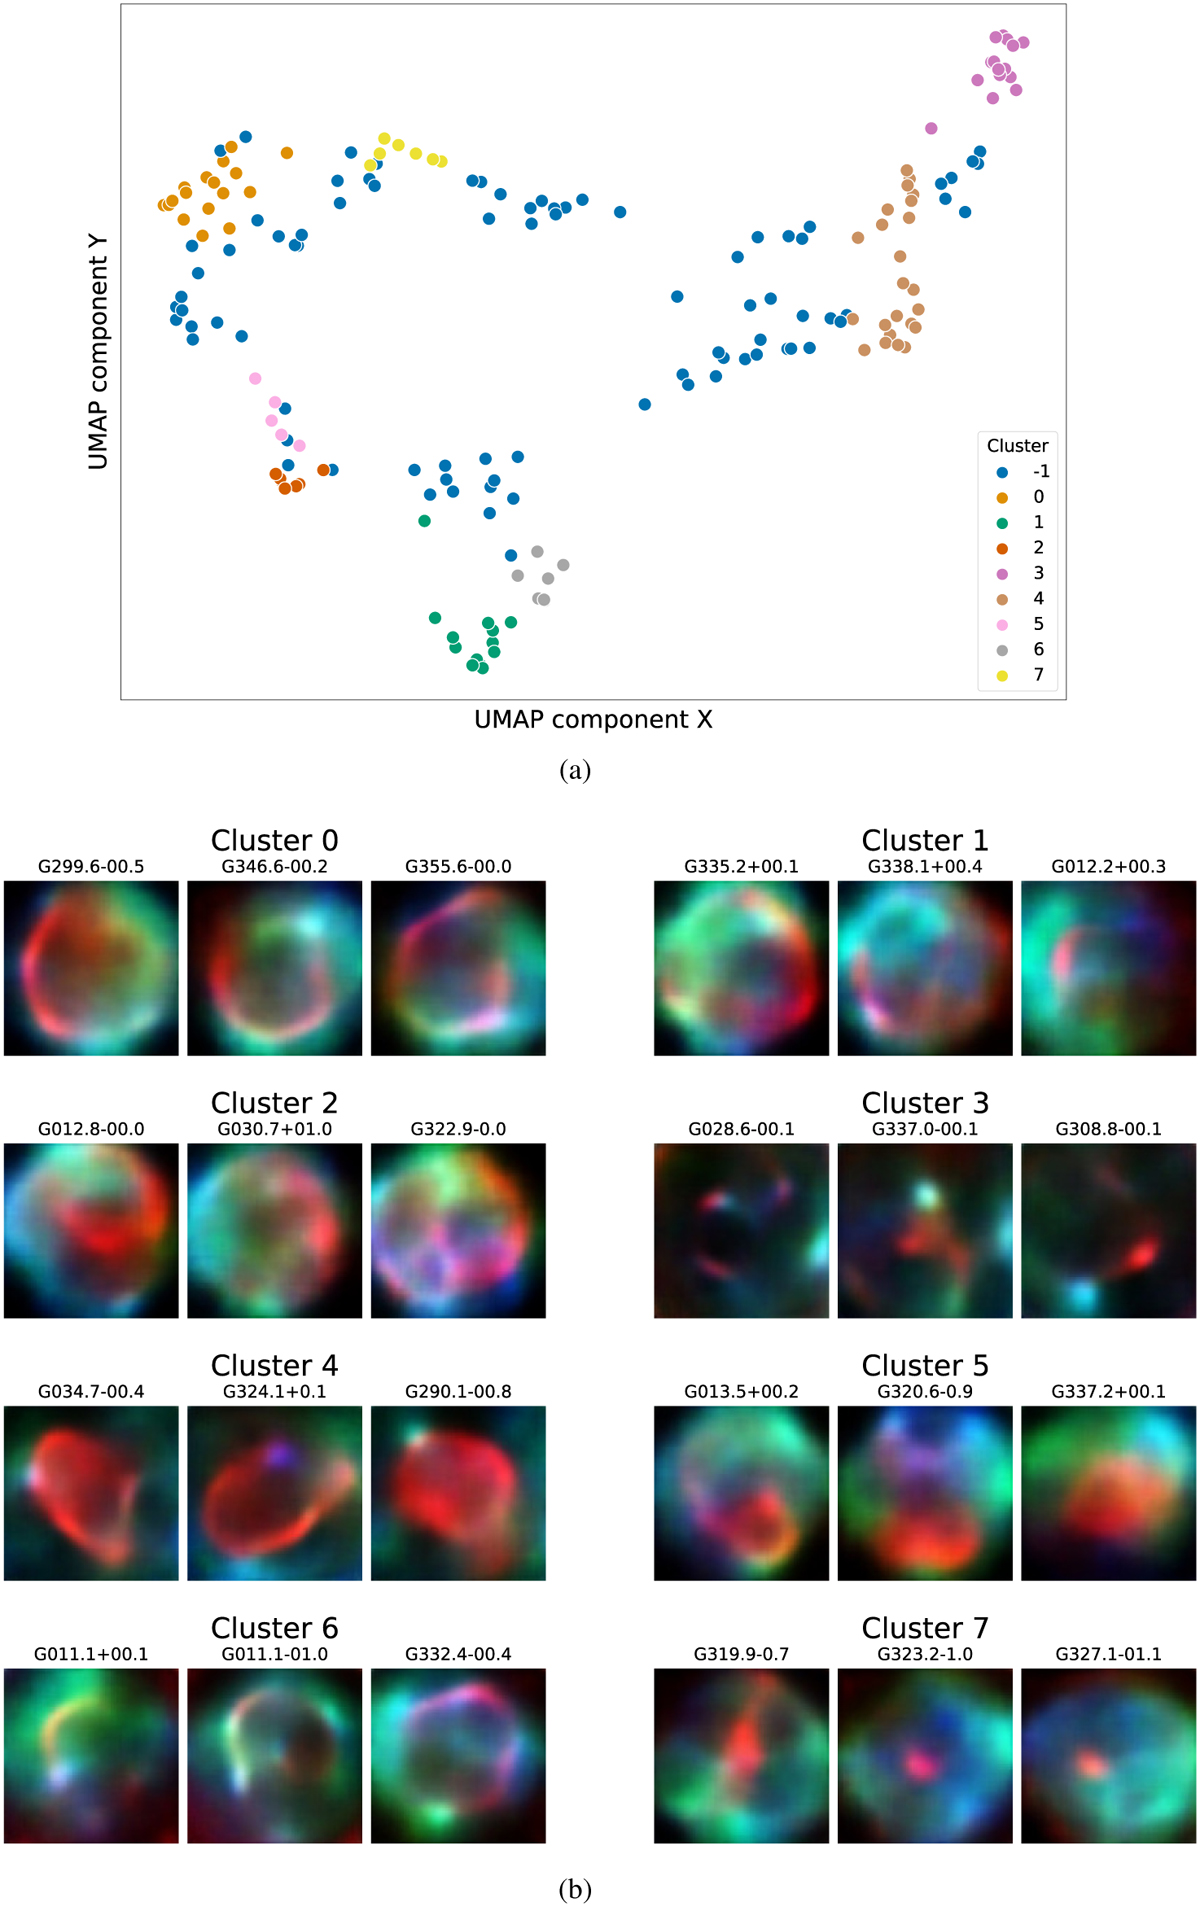
Clustering results obtained with experiment B3 in Table 2. Panel a: visualisation of DBSCAN clustering of experiment B3 SNR embeddings in a 6D manifold. A further 2D UMAP projection has been used for representation purposes only, with min_dist=0.1 and n_neighbors=15. Objects with label −1 are outliers. Panel b: for each cluster found by DBSCAN, three representative SNRs were chosen and are presented as model reconstructions to show their main features.
Current usage metrics show cumulative count of Article Views (full-text article views including HTML views, PDF and ePub downloads, according to the available data) and Abstracts Views on Vision4Press platform.
Data correspond to usage on the plateform after 2015. The current usage metrics is available 48-96 hours after online publication and is updated daily on week days.
Initial download of the metrics may take a while.