Open Access
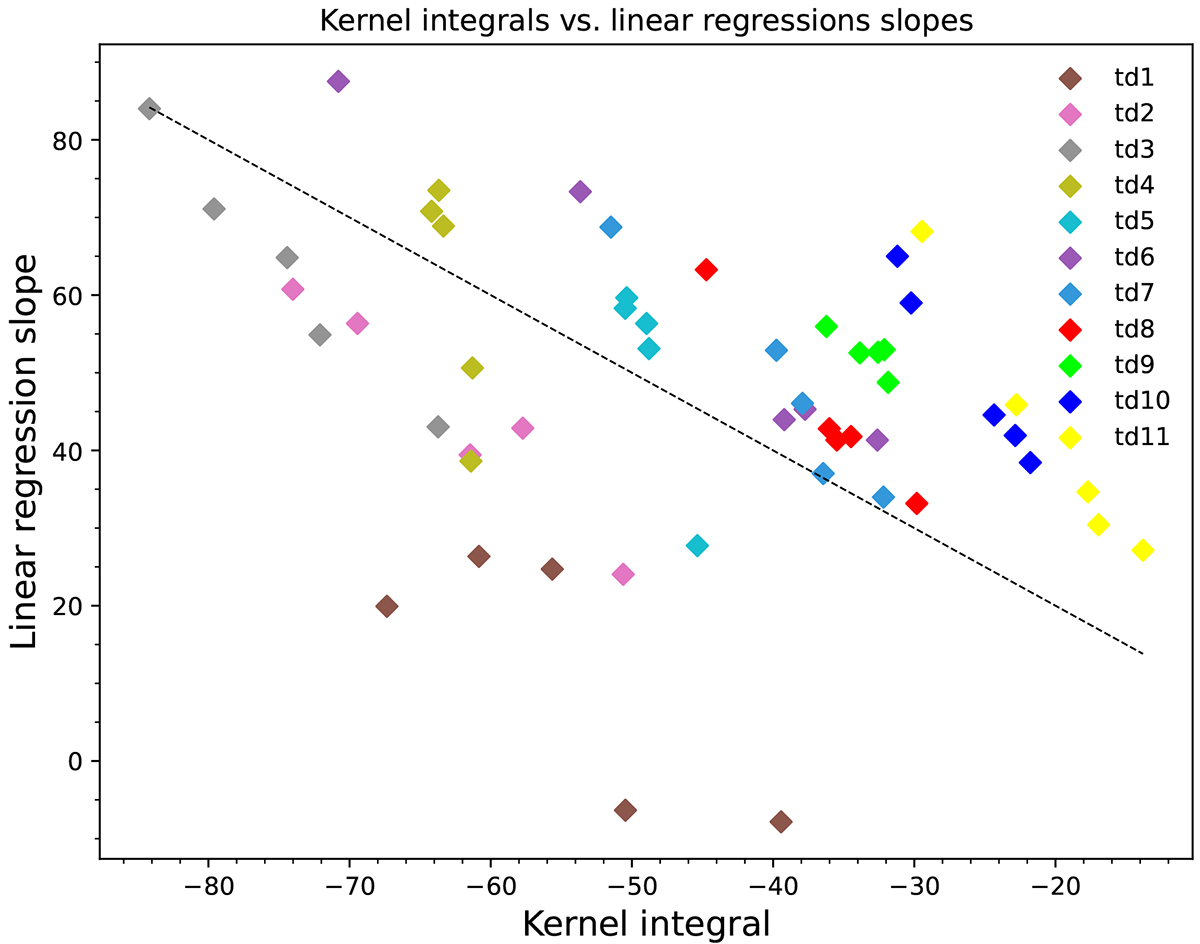
Fig. 5.
Download original image
Same as Fig. 4 with details of phase-speed filtered kernels. Moreover, this plot is obtained for a particular date, not for a combination of several dates. The dashed line indicates the expected line with a slope of −1. The values on both axes are in units of s/(km/s).
Current usage metrics show cumulative count of Article Views (full-text article views including HTML views, PDF and ePub downloads, according to the available data) and Abstracts Views on Vision4Press platform.
Data correspond to usage on the plateform after 2015. The current usage metrics is available 48-96 hours after online publication and is updated daily on week days.
Initial download of the metrics may take a while.