Fig. 3.
Download original image
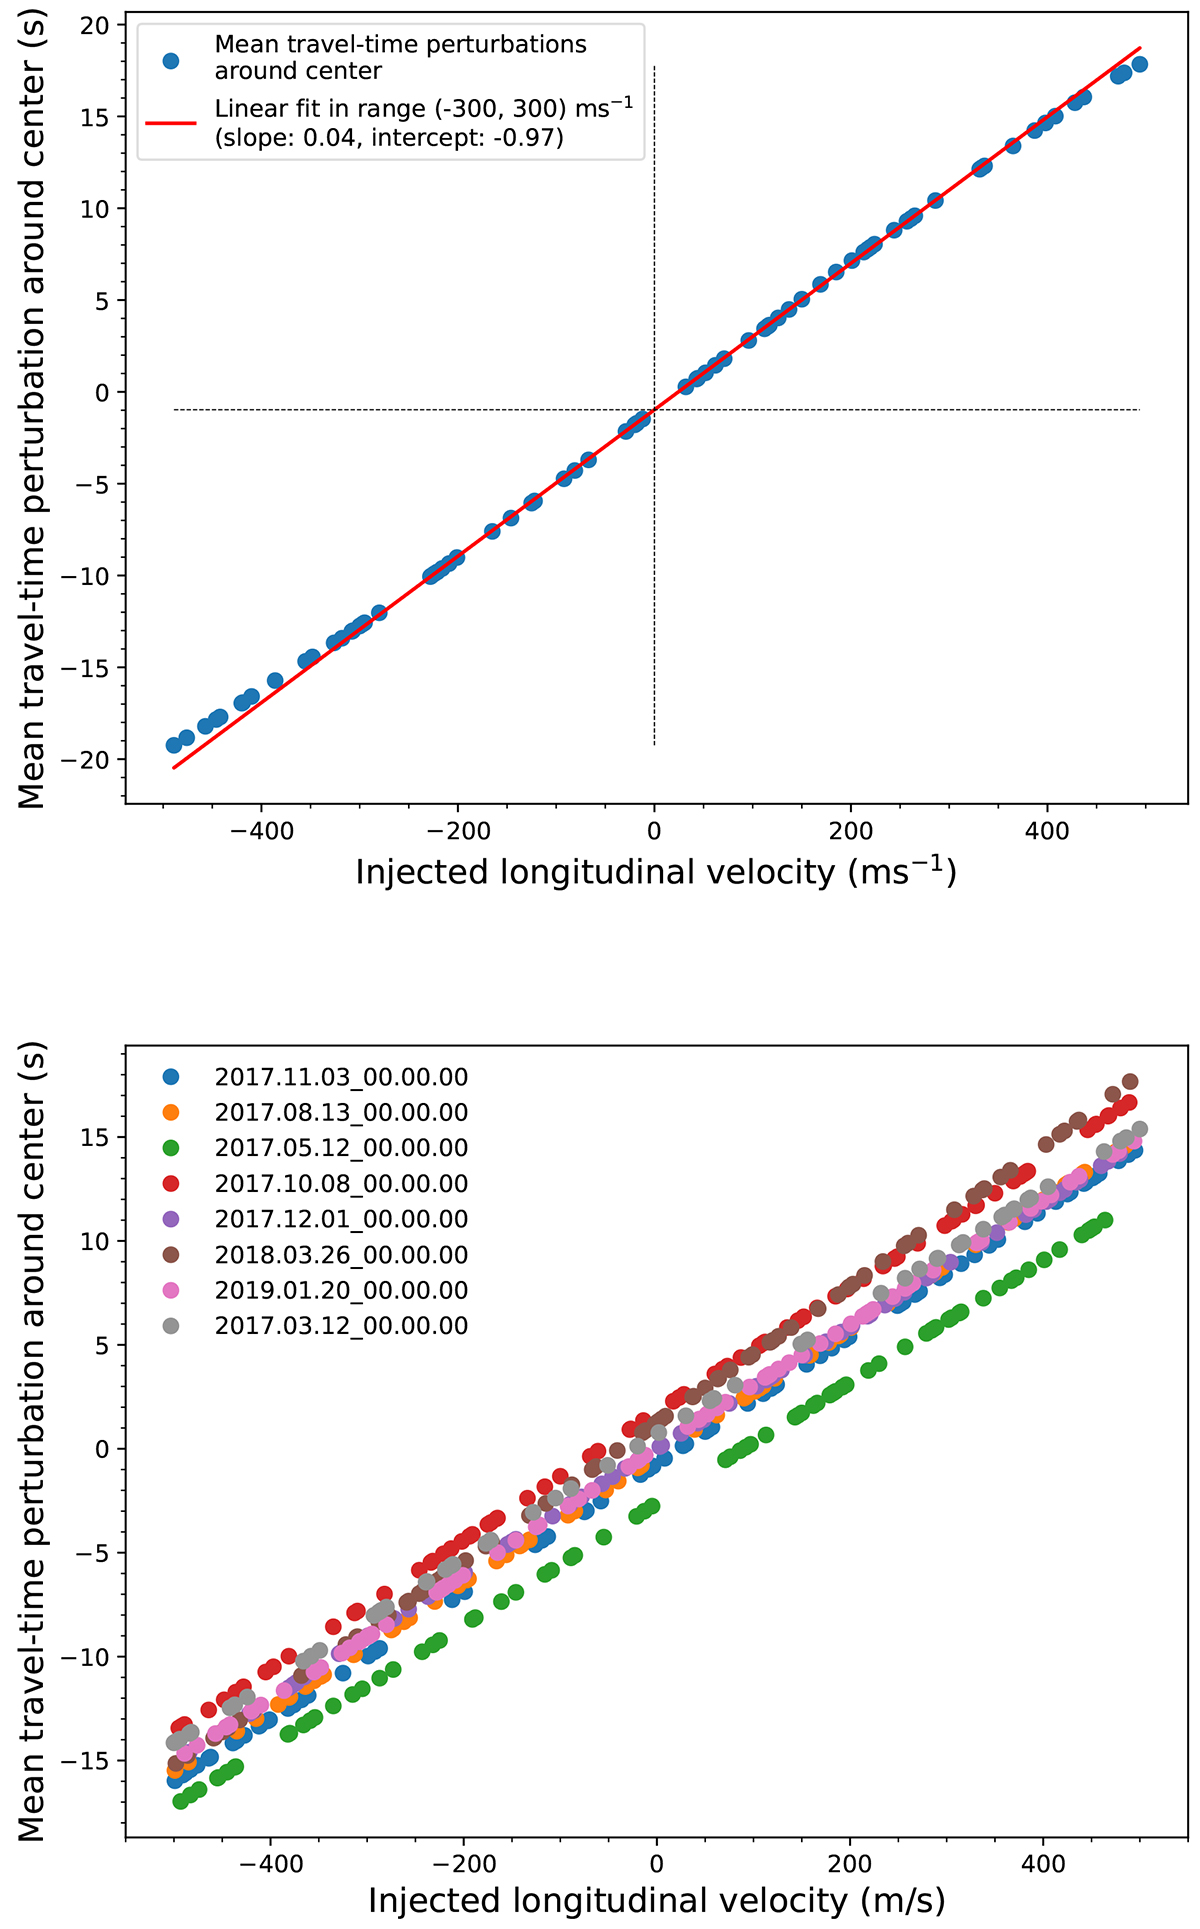
Measured average travel time around the disc centre as a function of the implanted velocity. Top: Plot for mode td4 at a distance of 9.9 px. The linear fit and its properties are also indicated. The slope of the linear fit corresponds to the total integral of the appropriate sensitivity kernel. Bottom: Similar plot for the p3 mode and Δ = 15 px when using several dates. Different dates are grouped around virtual lines that are shifted vertically, as indicated by the time stamps.
Current usage metrics show cumulative count of Article Views (full-text article views including HTML views, PDF and ePub downloads, according to the available data) and Abstracts Views on Vision4Press platform.
Data correspond to usage on the plateform after 2015. The current usage metrics is available 48-96 hours after online publication and is updated daily on week days.
Initial download of the metrics may take a while.