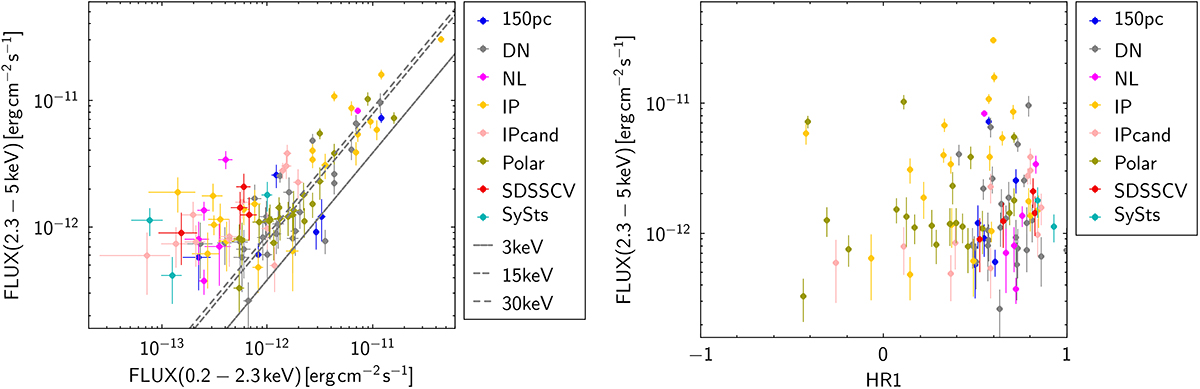
Fig. 11.
Download original image
DR1-detected CVs (main catalog) listed also in the hard catalog. The left panel compares the flux in the hard band (2.3–5.0 keV) with the flux in the detection band (0.2–2.3 keV). The diagonal lines illustrate the relation between the fluxes for a thermal plasma of 3, 15, and 30 keV, respectively, from bottom to top. The right panel shows the flux in the hard band as a function of the hardness ratio HR1. The one CRTS CV and the one AM CVn object are not shown to not confuse the diagram.
Current usage metrics show cumulative count of Article Views (full-text article views including HTML views, PDF and ePub downloads, according to the available data) and Abstracts Views on Vision4Press platform.
Data correspond to usage on the plateform after 2015. The current usage metrics is available 48-96 hours after online publication and is updated daily on week days.
Initial download of the metrics may take a while.