Fig. 6
Download original image
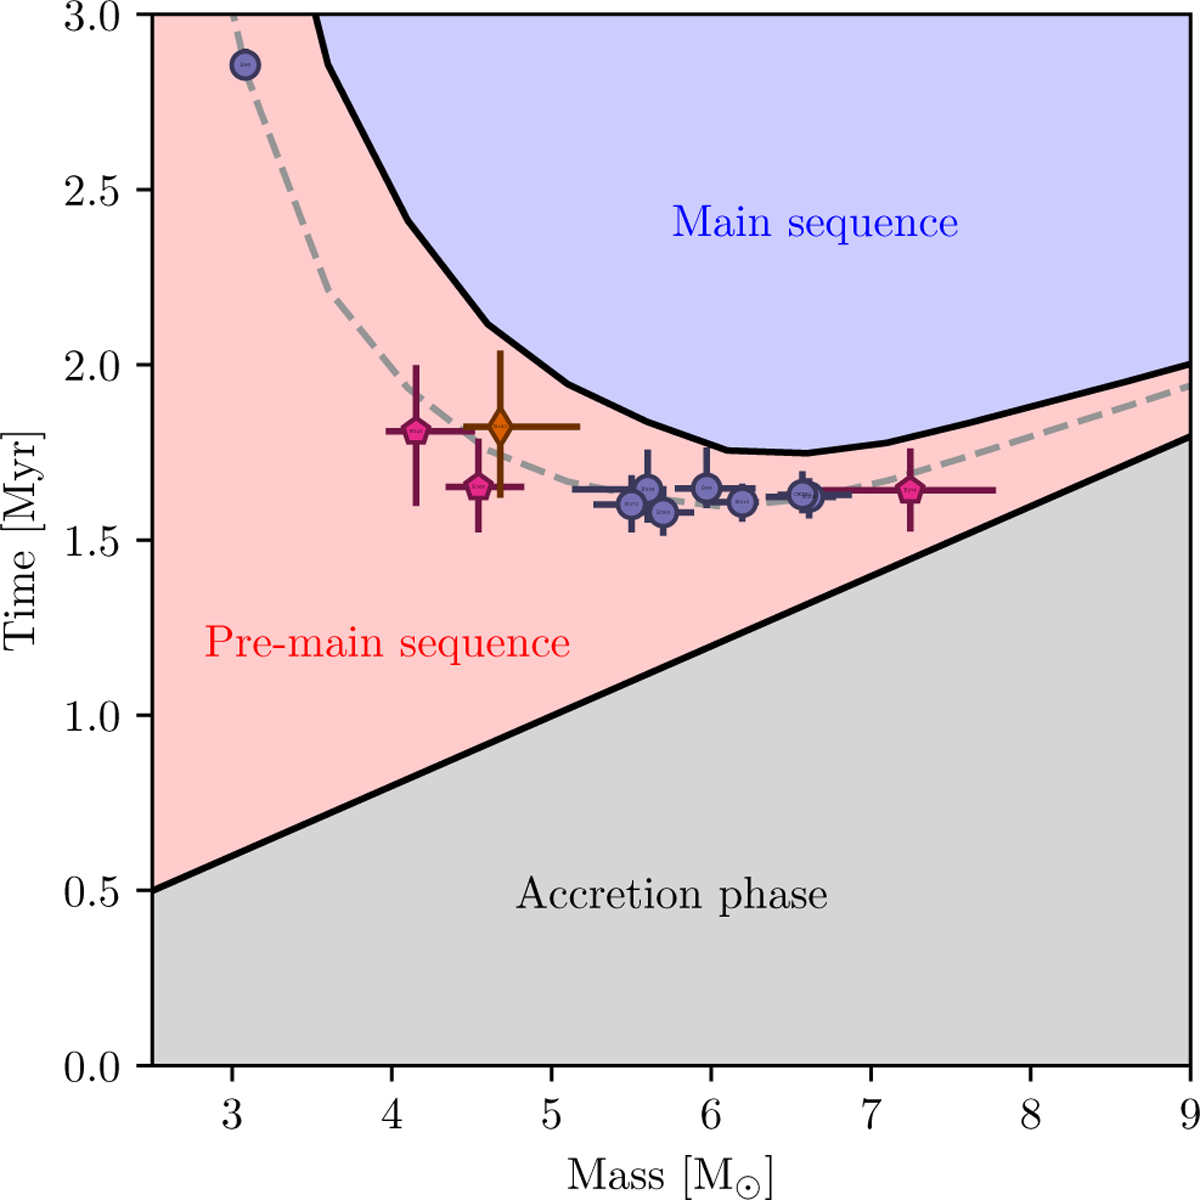
Time since the beginning of the main accretion phase for different stellar masses. The gray area marks the main accretion phase with a constant accretion rate for all masses. The red area shows the PMS phase in which the star contracts to the main sequence. Blue indicates the main sequence. The dashed gray line indicates 70% of the PMS phase, as in Fig. 5. The data points indicate the time it would have taken the stars to first accrete their mass and then contract to their current state.
Current usage metrics show cumulative count of Article Views (full-text article views including HTML views, PDF and ePub downloads, according to the available data) and Abstracts Views on Vision4Press platform.
Data correspond to usage on the plateform after 2015. The current usage metrics is available 48-96 hours after online publication and is updated daily on week days.
Initial download of the metrics may take a while.