Fig. 2
Download original image
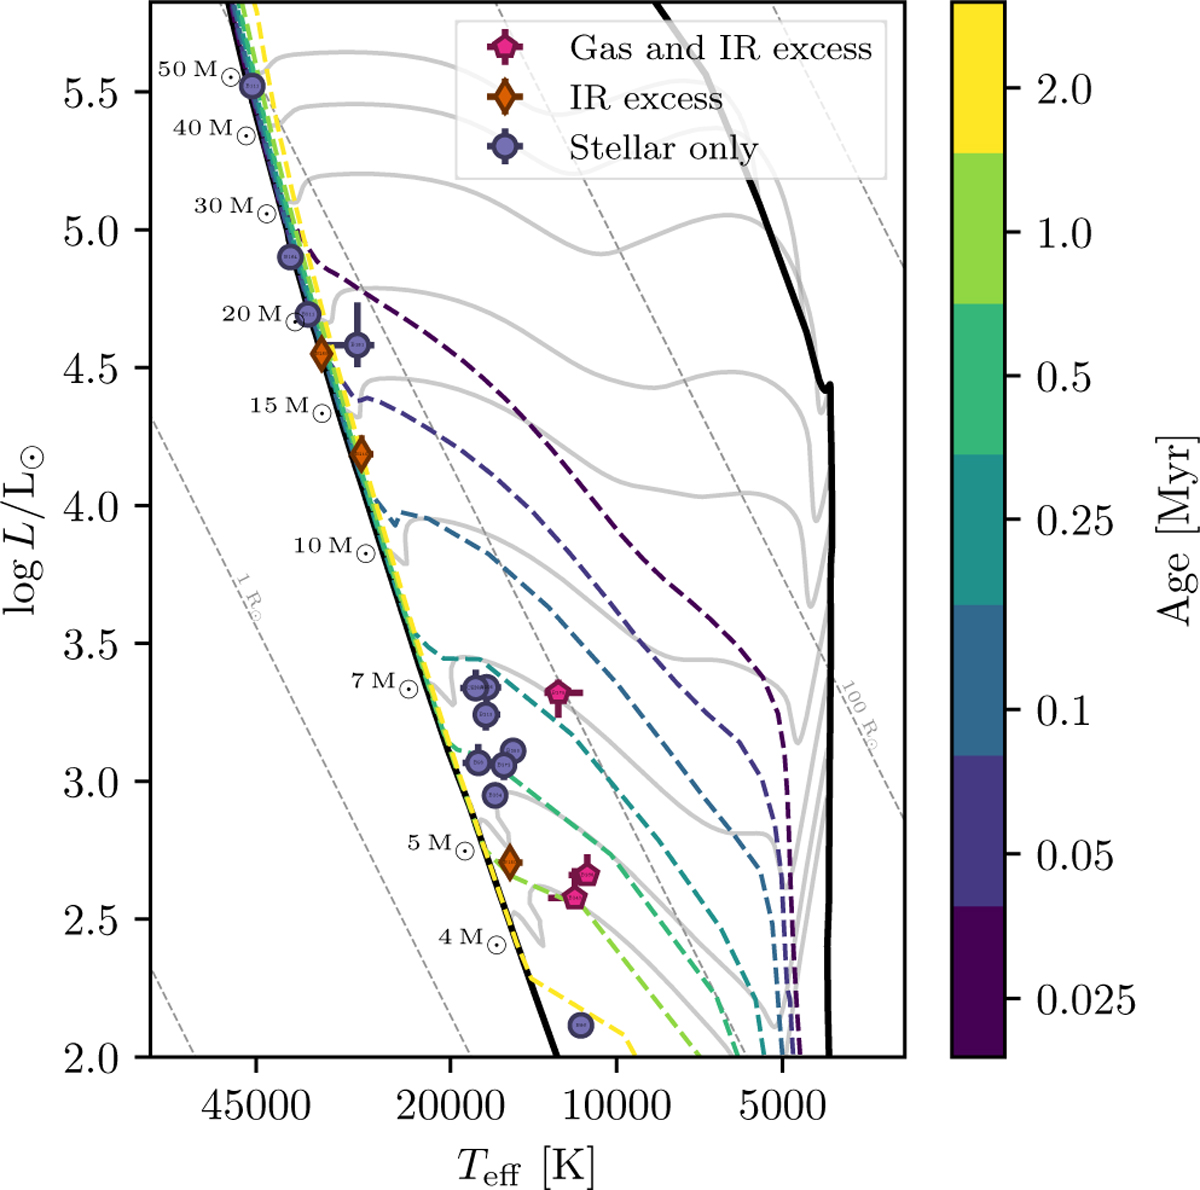
Hertzsprung-Russell diagram of the sample of M17 stars. The stars are separated into three categories, depending on their circumstellar emission features. Pink pentagons stars show both emission from a gaseous disk and IR excess emission from hot circumstellar dust. Orange indicates stars that only show IR excess, and purple indicates that no circumstellar material was detected here or by RT17. The MIST PMS evolutionary tracks are overplotted in gray, and the masses are labeled on the left. We show the ZAMS in black (on the left) and the birthline (on the right) (Dotter 2016; Choi et al. 2016). The isochrones (with t=0 at the birthline) are shown with the dashed colored lines. The thin dashed gray lines show the isoradius lines to guide the eye. The names of the stars are displayed on the points and are visible when zooming in.
Current usage metrics show cumulative count of Article Views (full-text article views including HTML views, PDF and ePub downloads, according to the available data) and Abstracts Views on Vision4Press platform.
Data correspond to usage on the plateform after 2015. The current usage metrics is available 48-96 hours after online publication and is updated daily on week days.
Initial download of the metrics may take a while.