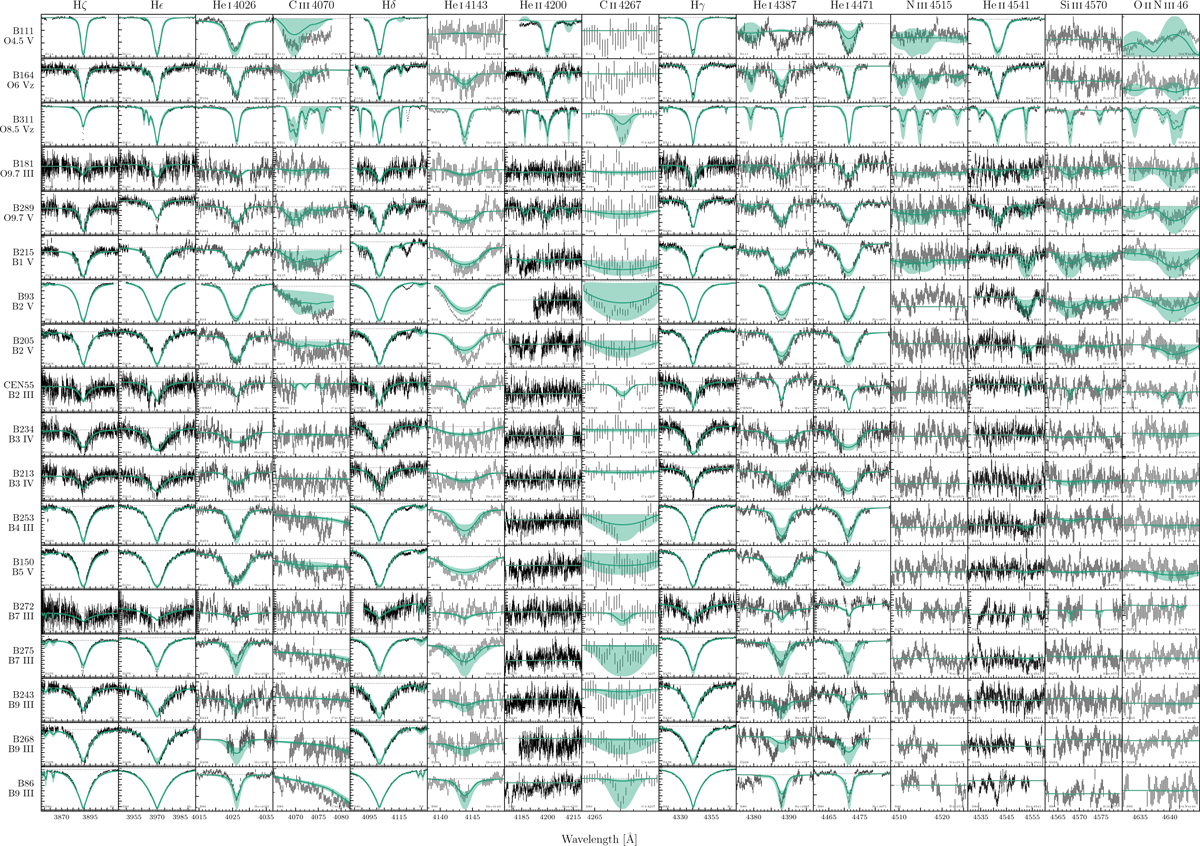
Fig. A.1
Download original image
Overview of FASTWIND/KIWI-GA fits of all studied lines of each star in the sample. The black vertical bars indicate the observed data, with the length indicating the 1σ uncertainty on the data. The green line shows the best fit model and the shaded region the range of models in the 1σ confidence interval. A more detailed overview of the fit results is shown in Figure 1 for B311 and available online for the other stars at https://doi.org/10.5281/zenodo.13285505.

Current usage metrics show cumulative count of Article Views (full-text article views including HTML views, PDF and ePub downloads, according to the available data) and Abstracts Views on Vision4Press platform.
Data correspond to usage on the plateform after 2015. The current usage metrics is available 48-96 hours after online publication and is updated daily on week days.
Initial download of the metrics may take a while.