Fig. 1
Download original image
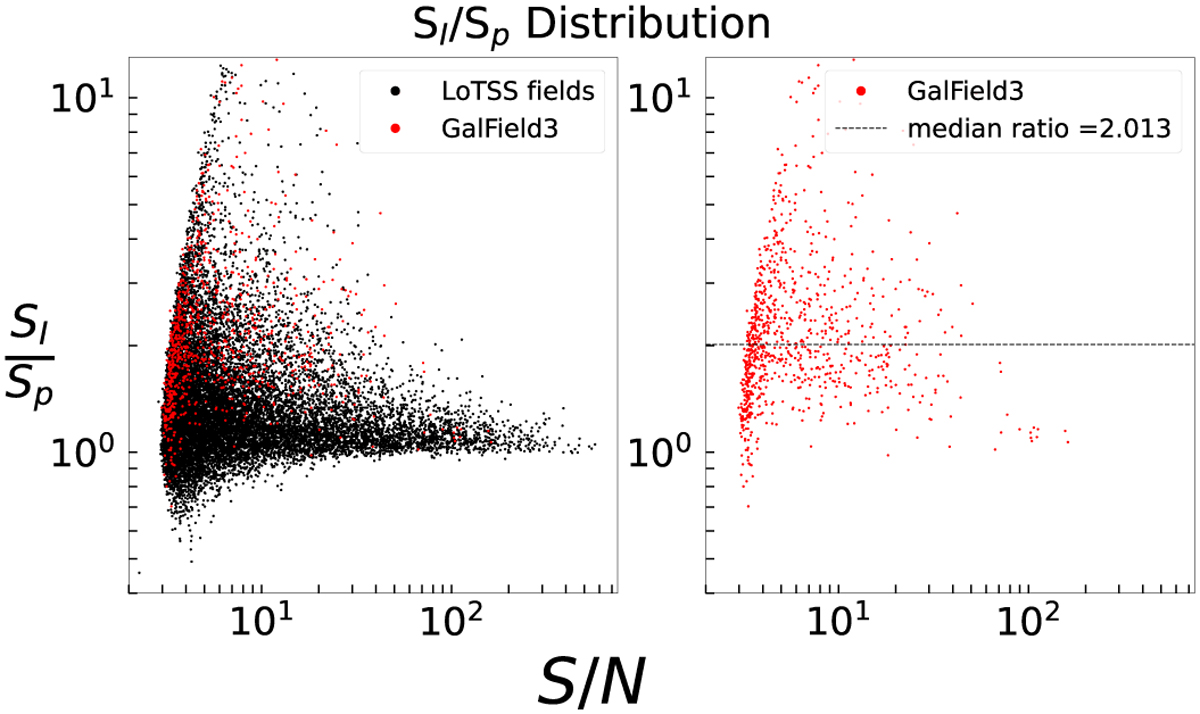
Integrated flux density to peak flux density ratio, as a function of the S/N of all images reduced with the LoTSS-DR2 pipelines. The left panel shows the catalogued sources of every LoTSS field concerned in this study, namely P297+30, P293+20, P289+10, P286+15, and P062+54 in black and the LoTSS reduced image of GalField3 in red. The right panel shows only the catalogued sources from the LoTSS image of GalField3. The black, dashed line marks the median ratio of integrated flux density to peak flux density for the source population, which is 2.013.
Current usage metrics show cumulative count of Article Views (full-text article views including HTML views, PDF and ePub downloads, according to the available data) and Abstracts Views on Vision4Press platform.
Data correspond to usage on the plateform after 2015. The current usage metrics is available 48-96 hours after online publication and is updated daily on week days.
Initial download of the metrics may take a while.