Fig. 5
Download original image
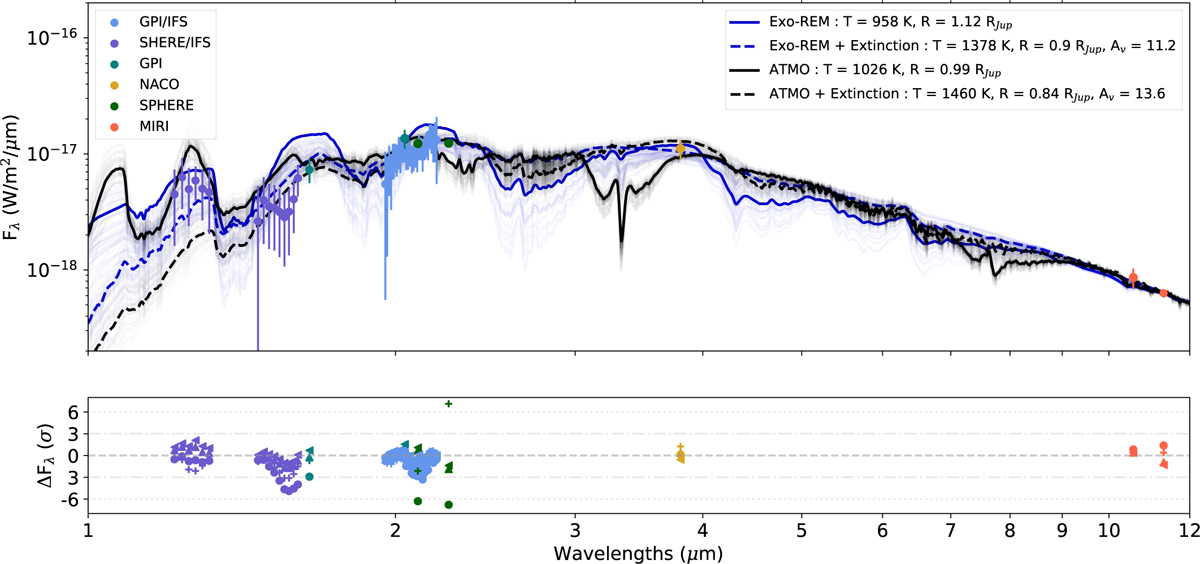
Exo-REM and ATMO best fits with all free parameters. The models with extinction are represented with dashed lines and those without extinction with plain lines. The faint lines correspond to models from the posteriors distribution at ± 1 σ. The residuals between data and Exo-REM models without extinction are indicated with filled circles, and crosses show ATMO models. The cases with extinction are indicated with upward triangles for Exo-REM and left triangles for ATMO. The same figure, adding a CPD component in the fitting process, is presented in Fig B.1.
Current usage metrics show cumulative count of Article Views (full-text article views including HTML views, PDF and ePub downloads, according to the available data) and Abstracts Views on Vision4Press platform.
Data correspond to usage on the plateform after 2015. The current usage metrics is available 48-96 hours after online publication and is updated daily on week days.
Initial download of the metrics may take a while.