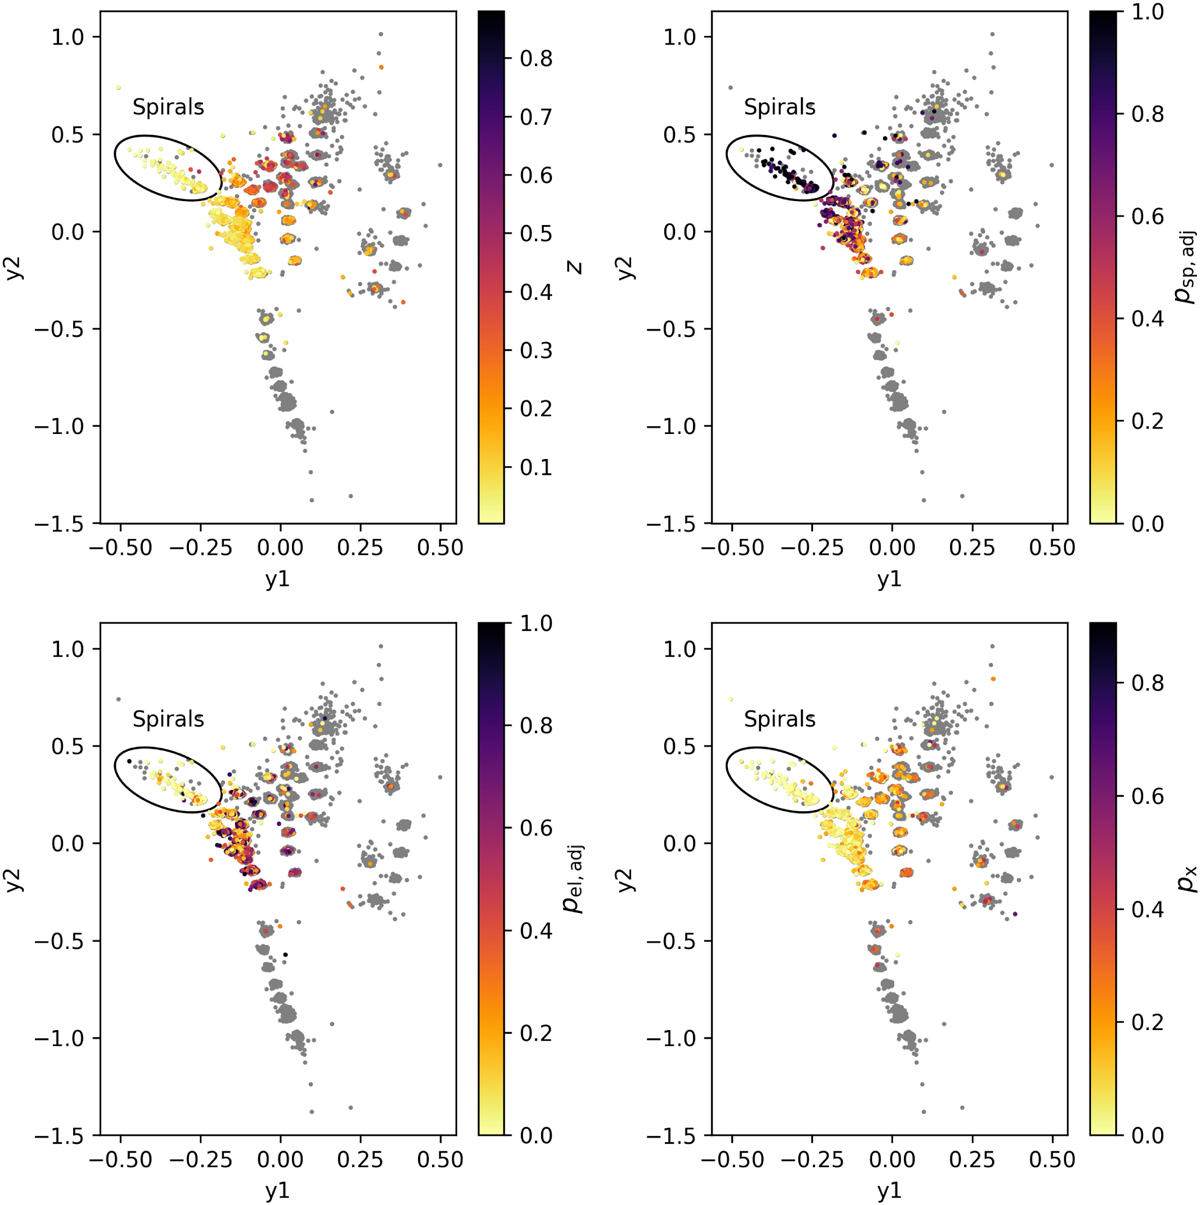
Fig. 6

Download original image
CPzS data set projected using SLMDS cross-matched with the GZ1 classifications. The top left plot shows the redshift of the galaxies in GZ1. The classifications (i.e., top right, bottom left, and bottom right plots) are color coded by the debiased vote fractions of the spiral (psp), elliptical (pel), and otherwise (i.e., star, merger, or unknown) (px) categories following from the debiasing technique of Bamford et al. (2009). For reliable debiasing of the classifications, the redshift should be in the range 0.001–0.25 (Lintott et al. 2011).
Current usage metrics show cumulative count of Article Views (full-text article views including HTML views, PDF and ePub downloads, according to the available data) and Abstracts Views on Vision4Press platform.
Data correspond to usage on the plateform after 2015. The current usage metrics is available 48-96 hours after online publication and is updated daily on week days.
Initial download of the metrics may take a while.


