Fig. 5
Download original image
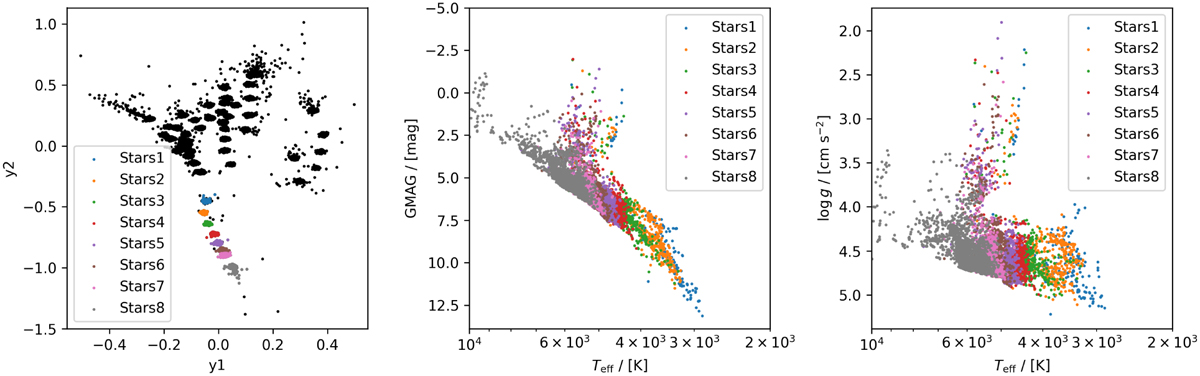
Analysis of the subclusters present in the SLMDS projection using astrophysical parameters from Gaia DR3 (Gaia Collaboration 2023; Creevey et al. 2023). Left: SLMDS projection of the CPzS data set with selected subclusters, each marked by an individual color. HR (middle) and surface gravity (log g) versus effective temperature (Teff) (right) diagrams. In these two plots, points are colored by their cluster, as given by the SDR projection.
Current usage metrics show cumulative count of Article Views (full-text article views including HTML views, PDF and ePub downloads, according to the available data) and Abstracts Views on Vision4Press platform.
Data correspond to usage on the plateform after 2015. The current usage metrics is available 48-96 hours after online publication and is updated daily on week days.
Initial download of the metrics may take a while.