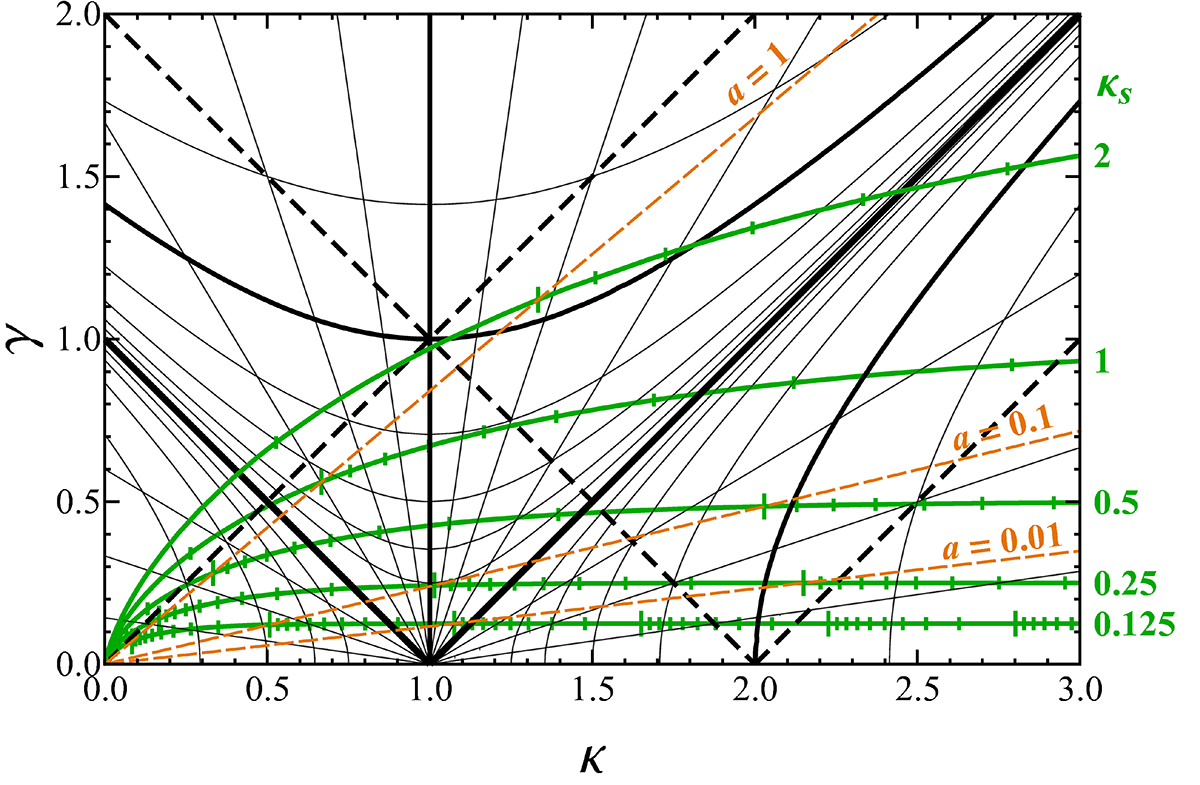
Fig. 15.
Download original image
Convergence–shear diagrams for e = 0 NFW lenses with five values of κs as marked along the right axis. The conversion between different values of κs is obtained simply by scaling the plot from the origin by the target/original κs value ratio. The three dashed orange lines connect points on the different curves corresponding to radius a = 1, to radius a = 0.1, and to radius a = 0.01.
Current usage metrics show cumulative count of Article Views (full-text article views including HTML views, PDF and ePub downloads, according to the available data) and Abstracts Views on Vision4Press platform.
Data correspond to usage on the plateform after 2015. The current usage metrics is available 48-96 hours after online publication and is updated daily on week days.
Initial download of the metrics may take a while.