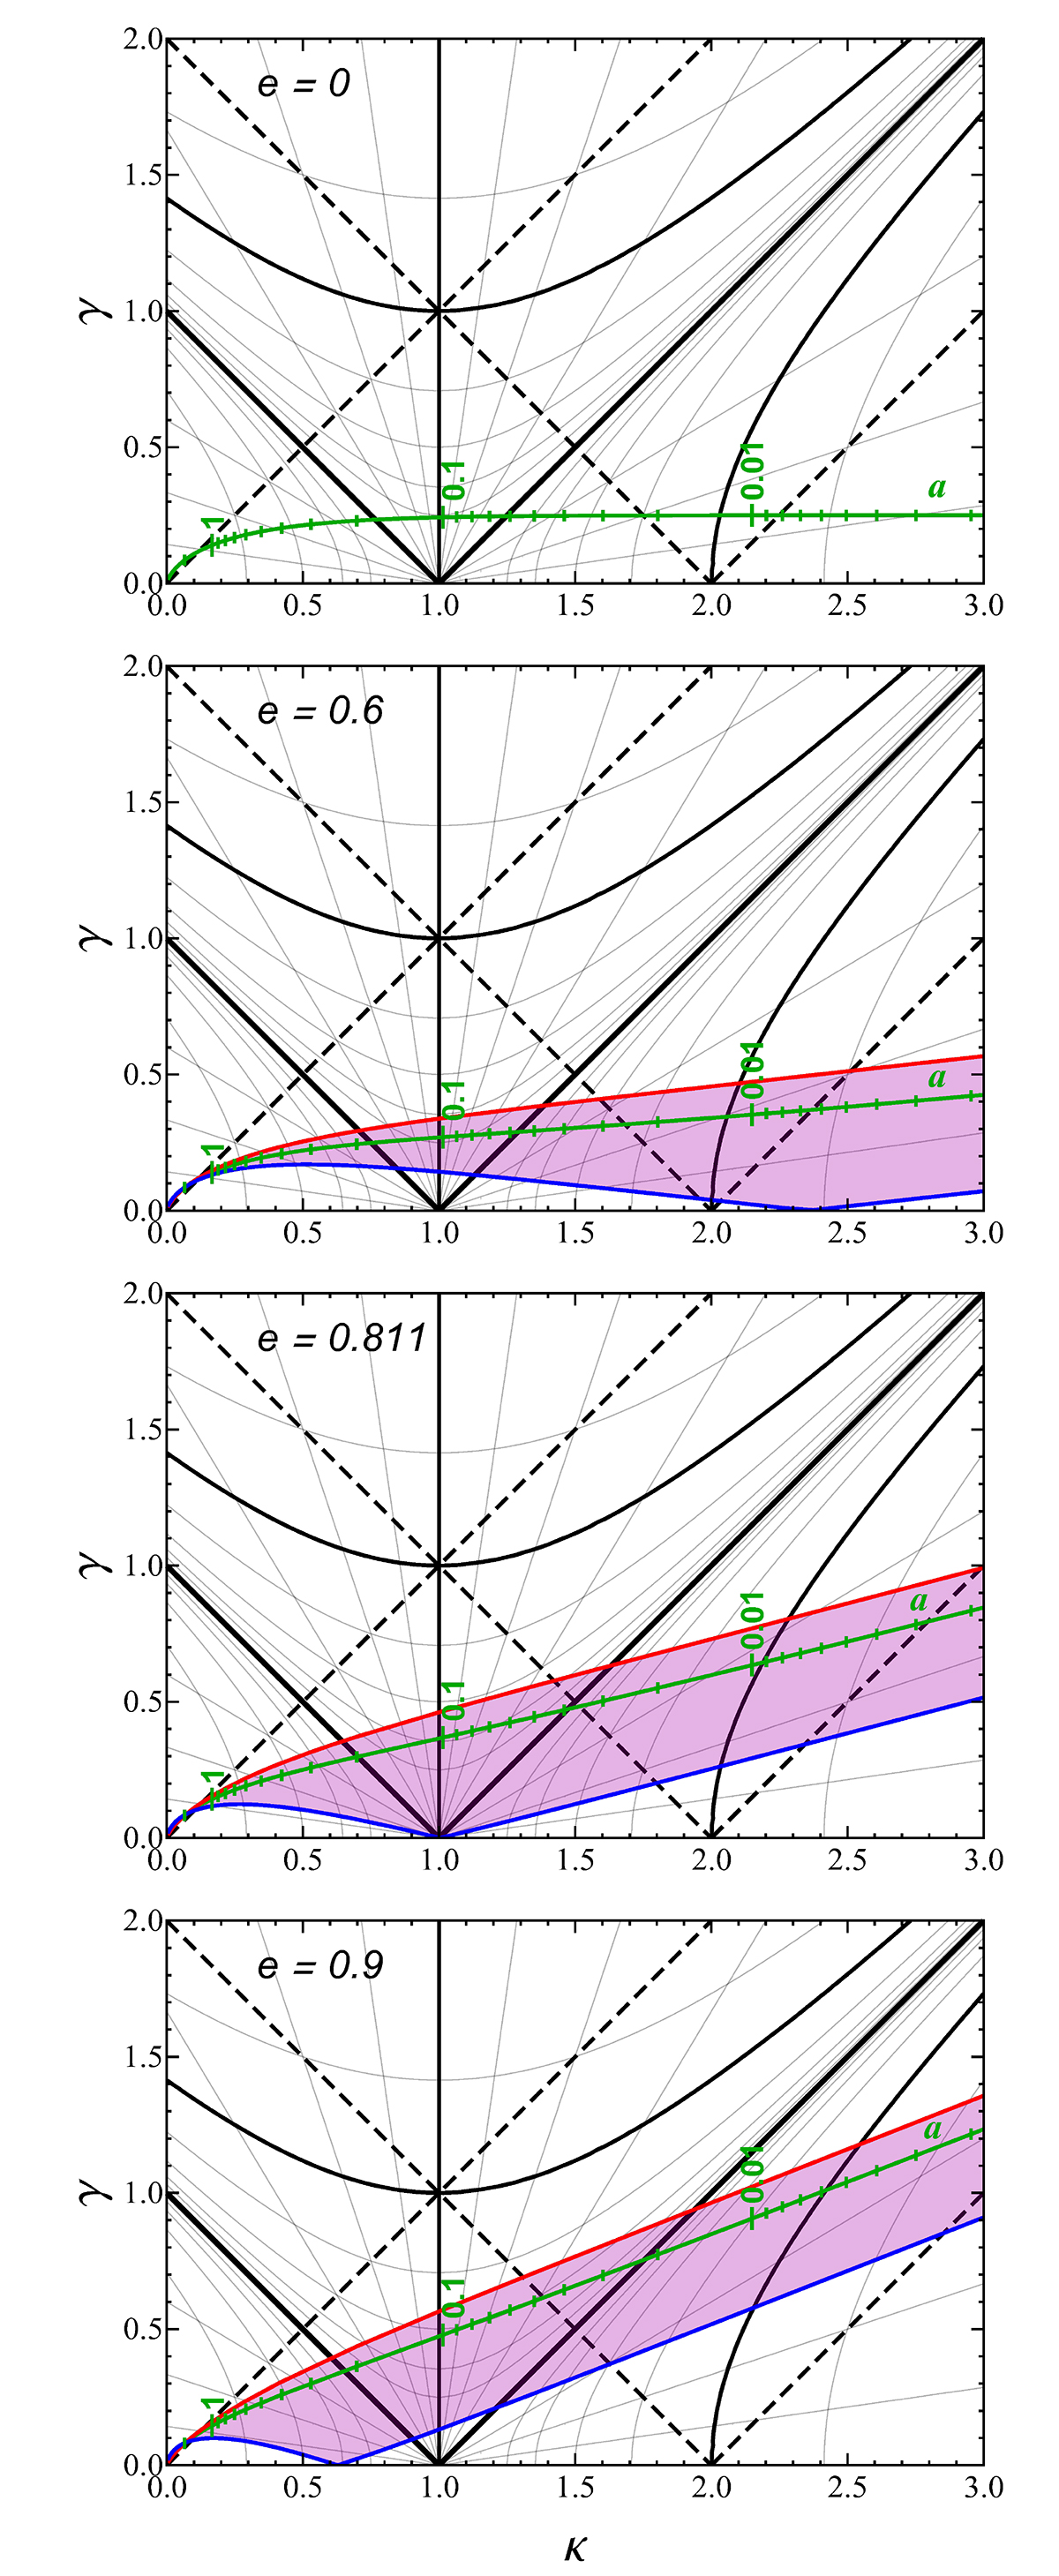
Fig. 14.
Download original image
Convergence–shear diagrams for the ellipsoidal NFW lens with κs = 0.25 and eccentricities e ∈ {0, 0.6, 0.811, 0.9} as marked in the panels. In the top row with e = 0 the green curve marks the (κ, γ) combinations occurring in the lens plane as a function of radius a marked by the green tick marks. In each of the three lower rows the magenta band marks the (κ, γ) combinations occurring in the lens plane, with its vertical cross-sections indicating the shear range along the ellipse with semi-major axis a. The red and blue curves mark the shear along the major and minor axis, respectively. For reading the image properties from the diagrams, see Sect. 4.5.1.
Current usage metrics show cumulative count of Article Views (full-text article views including HTML views, PDF and ePub downloads, according to the available data) and Abstracts Views on Vision4Press platform.
Data correspond to usage on the plateform after 2015. The current usage metrics is available 48-96 hours after online publication and is updated daily on week days.
Initial download of the metrics may take a while.