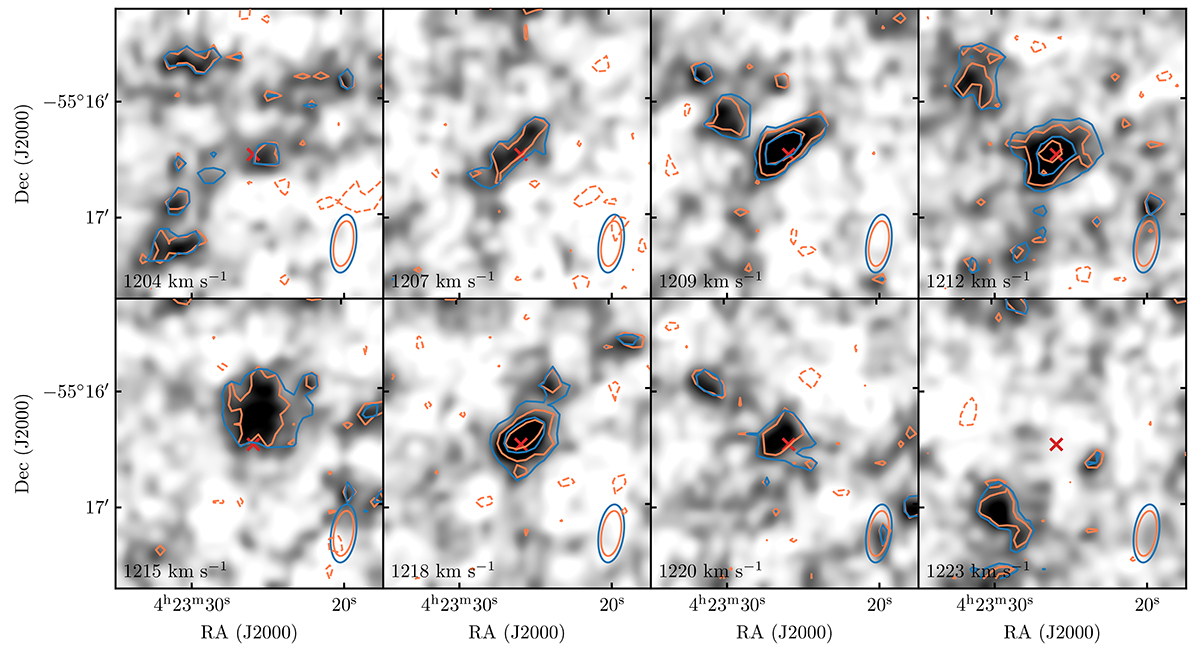
Fig. B.2.
Download original image
Channel maps of the H I emission of LSB-D maps from the r10 and r15 datacubes (orange and blue contours, respectively). One every two channels is shown, contour levels increase as 2.5σ × 2n (n = 0, 1). The red cross marks the centre of the optical body of the galaxy. The PSFs of the datacubes are shown in the bottom left corner.
Current usage metrics show cumulative count of Article Views (full-text article views including HTML views, PDF and ePub downloads, according to the available data) and Abstracts Views on Vision4Press platform.
Data correspond to usage on the plateform after 2015. The current usage metrics is available 48-96 hours after online publication and is updated daily on week days.
Initial download of the metrics may take a while.