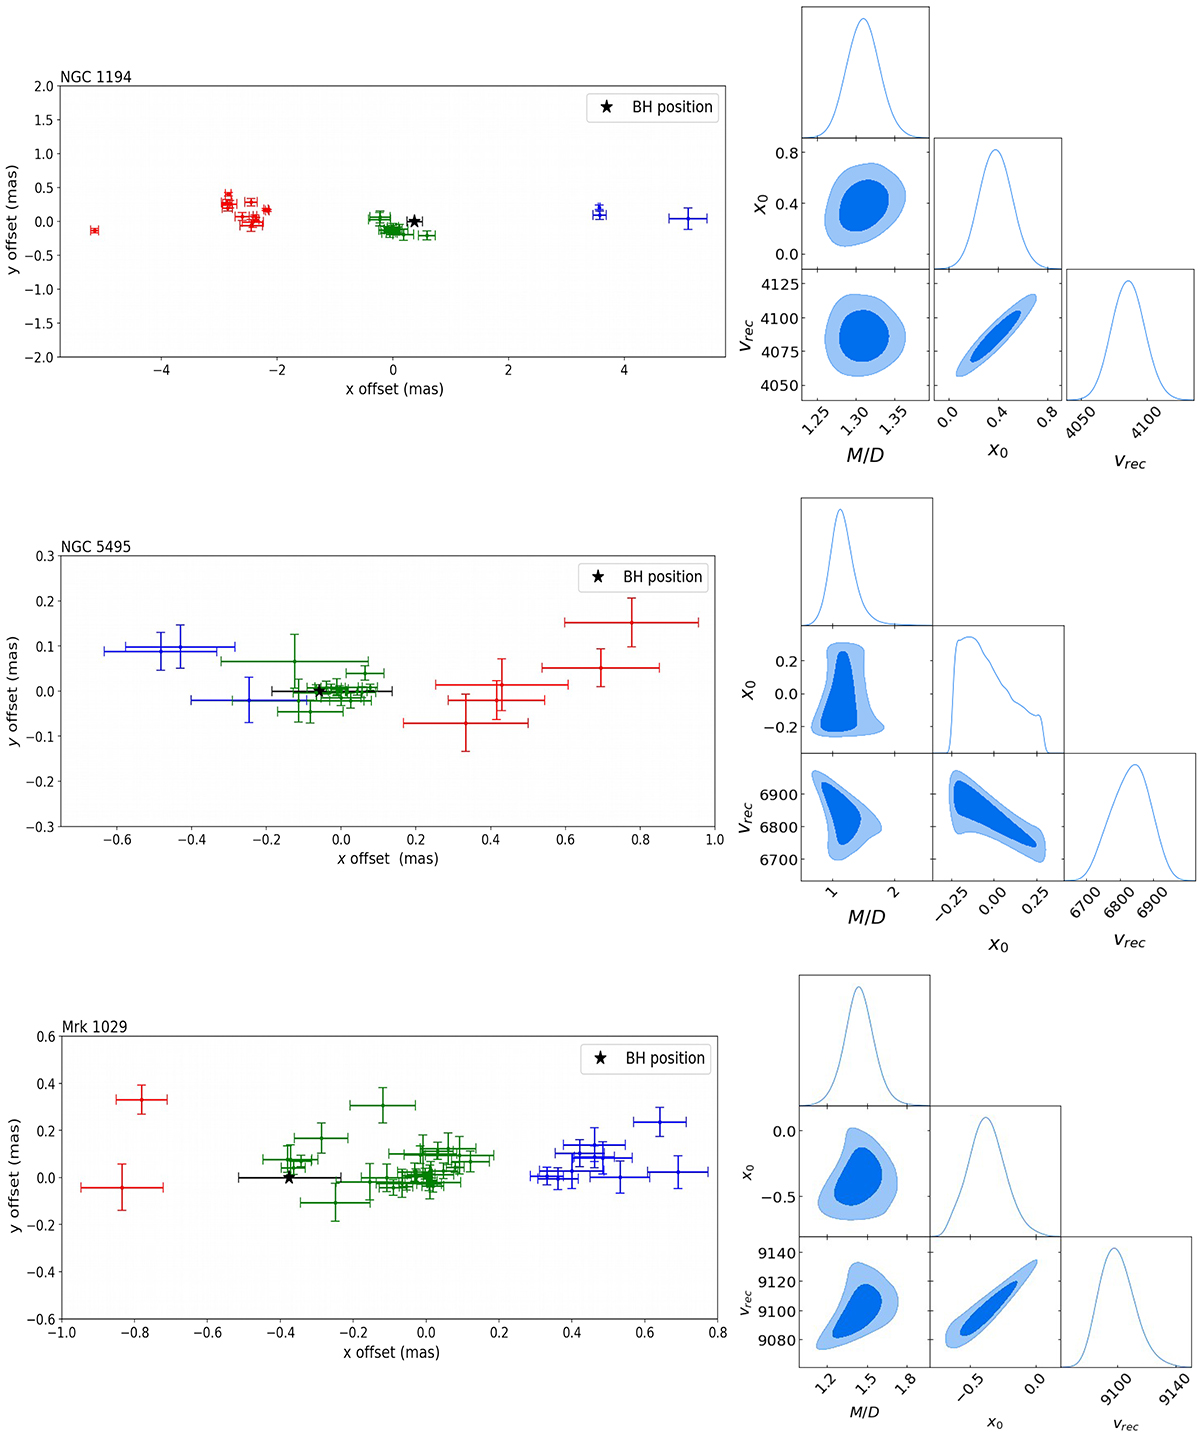
Fig. 1.
Download original image
Maser disks and posterior probability distributions for the galaxies NGC 1194, NGC 5495, and Mrk 1029. The maser disk plots show the three groups of maser features viewed edge-on with their observational error. The star symbol refers to the best fit for the BH position on the disk. The black line through this star symbol indicates the uncertainty in the position of BH. The blue graphs in the right panels show the posterior probability distribution with the contour levels corresponding to 1σ and 2σ confidence regions.
Current usage metrics show cumulative count of Article Views (full-text article views including HTML views, PDF and ePub downloads, according to the available data) and Abstracts Views on Vision4Press platform.
Data correspond to usage on the plateform after 2015. The current usage metrics is available 48-96 hours after online publication and is updated daily on week days.
Initial download of the metrics may take a while.