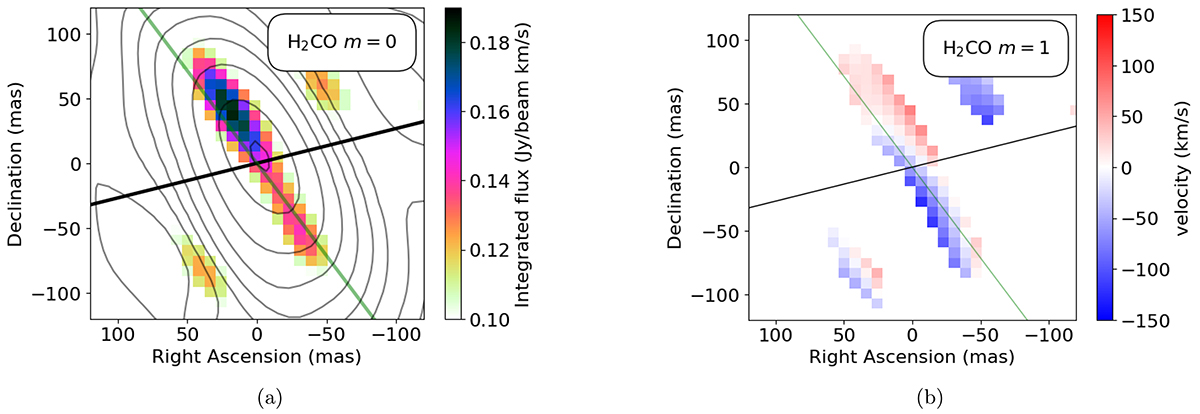
Fig. A.1.
Download original image
e-MERLIN observations of H2CO 4.83 GHz emission toward the nuclear region of Zw049.057. (a) moment 0 map of the emission, overlaid with e-MERLIN C Band continuum emission contour map. (b) moment 1 map of the emission. Directions of the CO outflow (PACO = 105°), and disk major axis (PAmaj = 30°) are indicated by the dashed black line, solid black line, and solid green line, respectively. Figure is a zoom-in of Fig. (1b) and (1c).
Current usage metrics show cumulative count of Article Views (full-text article views including HTML views, PDF and ePub downloads, according to the available data) and Abstracts Views on Vision4Press platform.
Data correspond to usage on the plateform after 2015. The current usage metrics is available 48-96 hours after online publication and is updated daily on week days.
Initial download of the metrics may take a while.