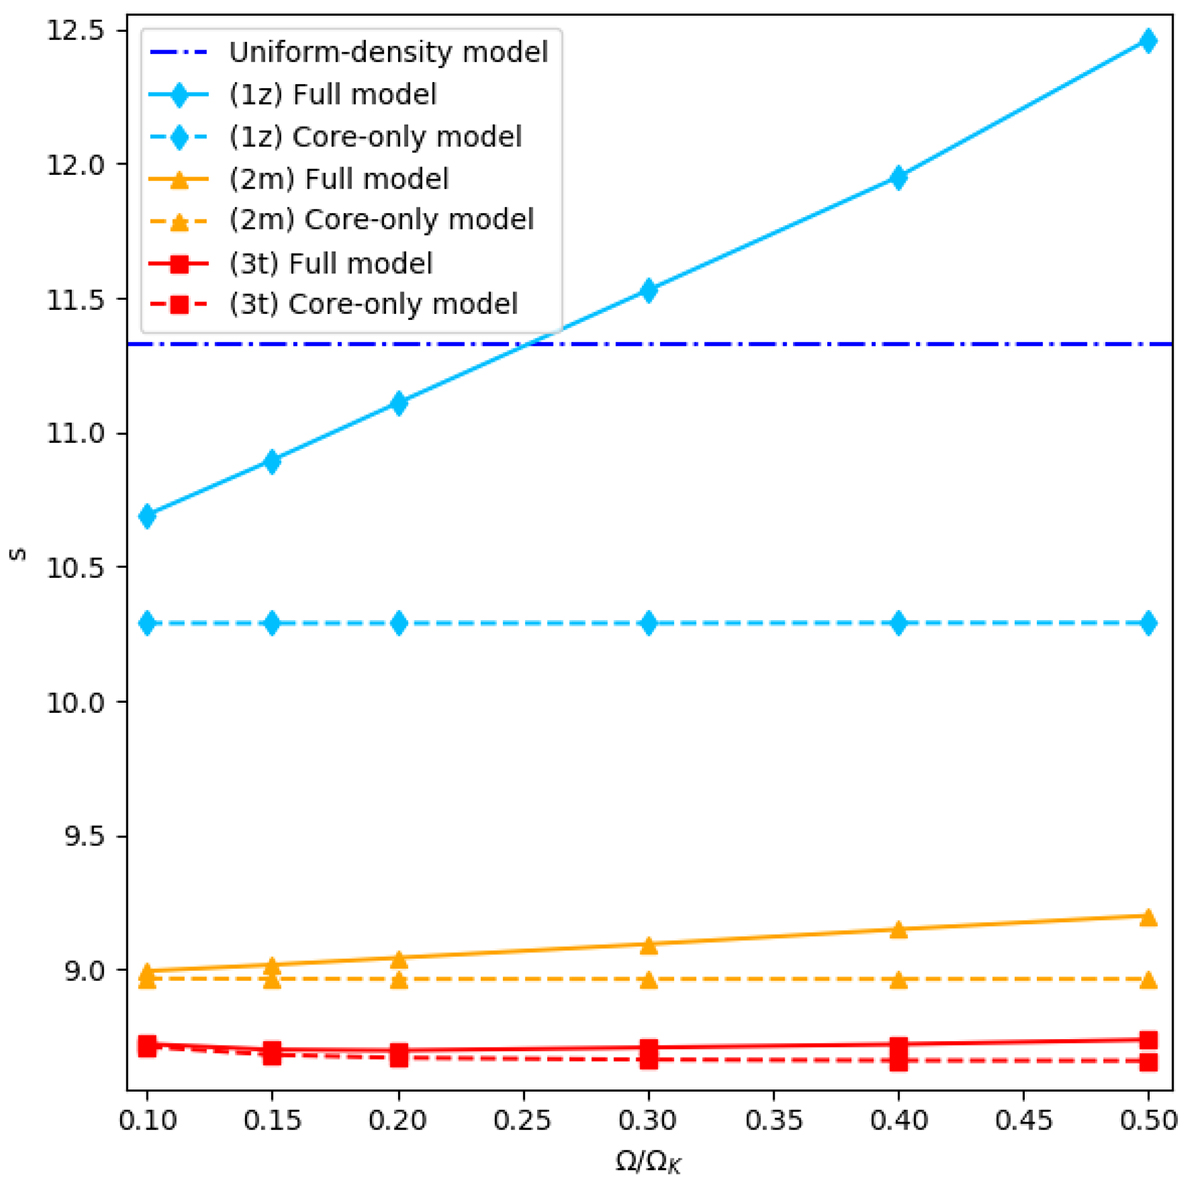
Fig. 10.
Download original image
Evolution of the centre of the dip sc obtained using a full model (full line) and evolution of the spin parameter of the inertial mode obtained using a core-only model (dotted line). The dash-and-dot blue line shows the spin parameter of the inertial mode in the case of a uniform density core (analytical model). The light blue curves refer to the model 1z, orange curves to the model 2m, and red curves to the model 3t.
Current usage metrics show cumulative count of Article Views (full-text article views including HTML views, PDF and ePub downloads, according to the available data) and Abstracts Views on Vision4Press platform.
Data correspond to usage on the plateform after 2015. The current usage metrics is available 48-96 hours after online publication and is updated daily on week days.
Initial download of the metrics may take a while.