Fig. A.1
Download original image
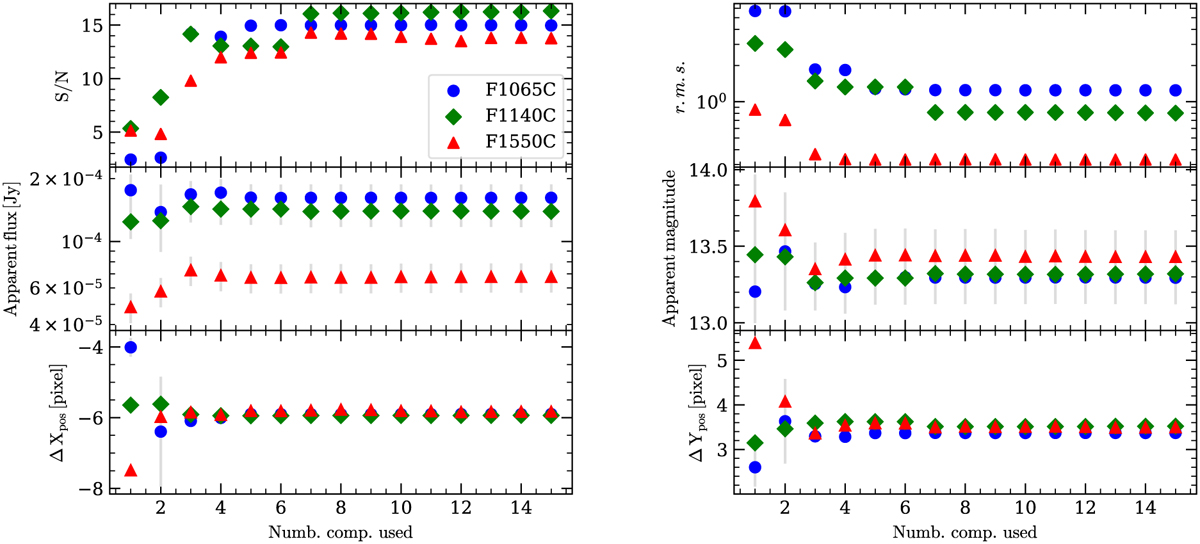
General extraction quality for HR 2562 B. Left-top: Signal-to-noise ratio as a function of the number of components used (NPC). Left-middle: Apparent flux vs NPC. Left-bottom: Relative position (with respect to the coronograph) along the X-axis vs NPC (in pixels). Right-top: Root-mean-square in the residual image after subtracting the companion, vs NPC. Right-middle: Apparent magnitude in Vega system vs NPC. Right-bottom: Relative position along the Y-axis vs NPC (in pixels). Blue circles, red triangles, and green diamonds correspond to the bandpasses F1065C, F1140C, and F1550C, respectively. Vertical gray lines are the uncertainties.
Current usage metrics show cumulative count of Article Views (full-text article views including HTML views, PDF and ePub downloads, according to the available data) and Abstracts Views on Vision4Press platform.
Data correspond to usage on the plateform after 2015. The current usage metrics is available 48-96 hours after online publication and is updated daily on week days.
Initial download of the metrics may take a while.