Fig. 14.
Download original image
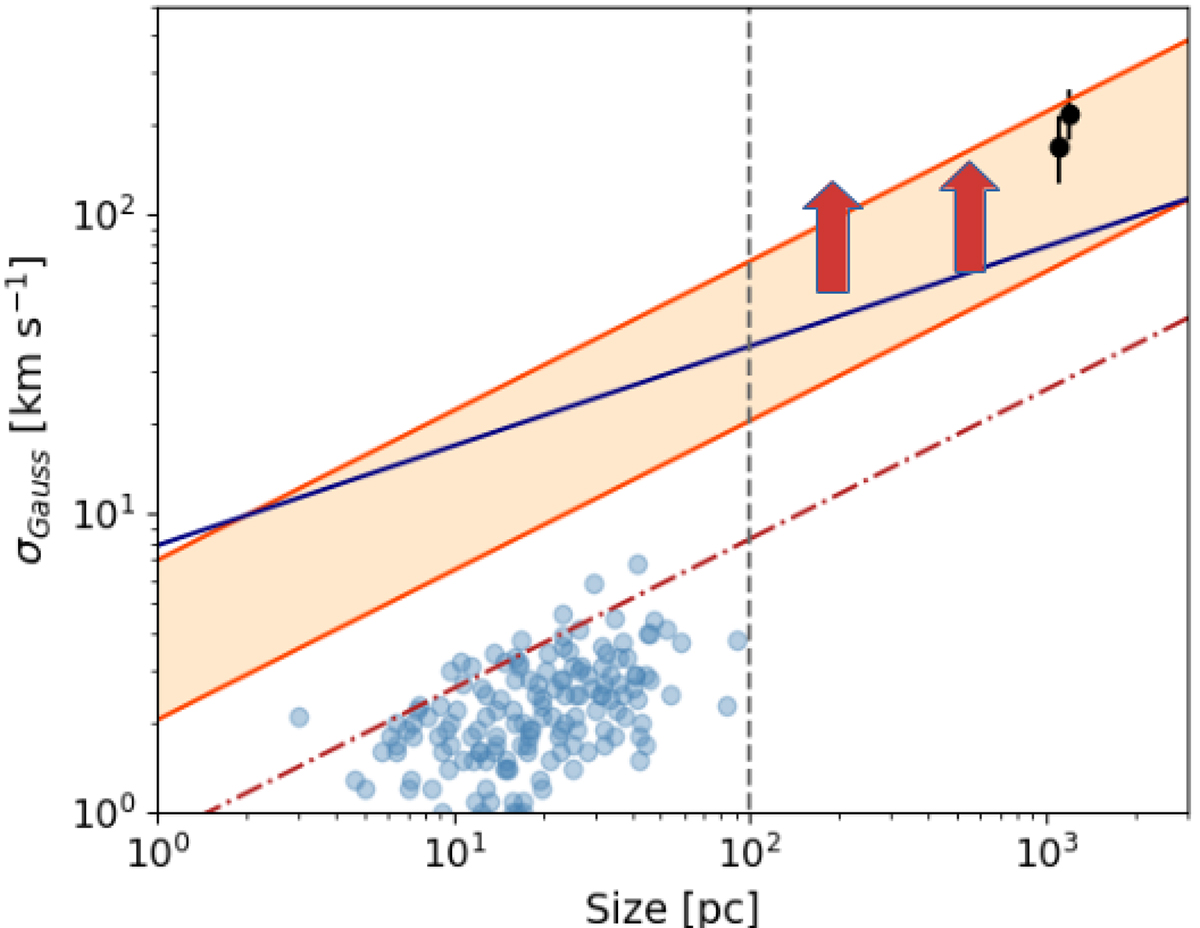
Gaussian line width, σ, of warm molecular gas in 3C 326 N as a function of radius. The minimal line widths observed in H2 1–0 S(3) and H2 0–0 S(3) at spatial resolutions corresponding to 190 pc and 530 pc, respectively, are shown as large, upward-pointing arrows. The broadest line widths observed in both lines are > 1000 km s−1, and fall well outside the plot. Black dots show previous SINFONI observations of H2 1–0 S(3) at kpc-scale resolution. The red dotted line shows the position of gas clouds with αvir = 1, for the gas-mass surface densities observed in 3C 326 N. Light blue circles show molecular clouds in the Milky Way. The yellow band indicates the range where the data should fall if the Larson (1981) scaling relations of turbulent clouds apply. The blue line indicates where the lines should fall for typical mass-to-light ratios of gas cooling through turbulent dissipation. See text for details.
Current usage metrics show cumulative count of Article Views (full-text article views including HTML views, PDF and ePub downloads, according to the available data) and Abstracts Views on Vision4Press platform.
Data correspond to usage on the plateform after 2015. The current usage metrics is available 48-96 hours after online publication and is updated daily on week days.
Initial download of the metrics may take a while.