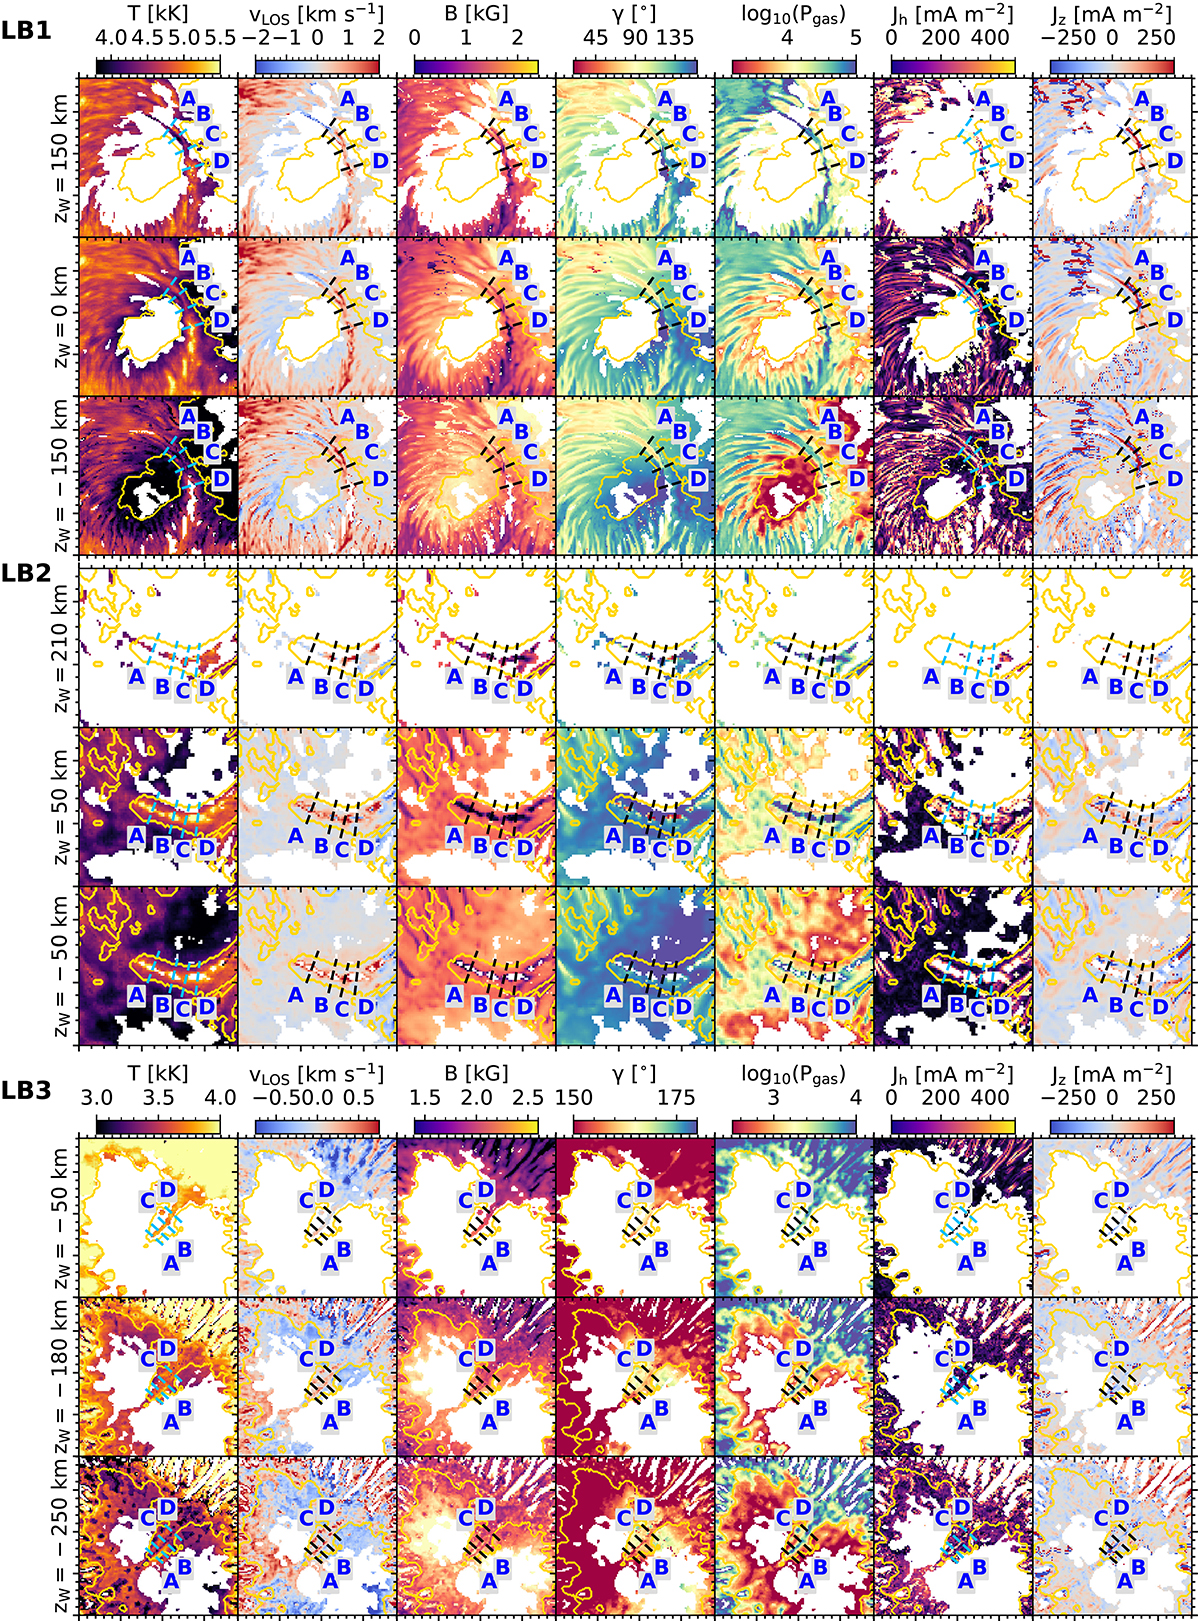
Fig. 5.
Download original image
Physical quantities inferred at different heights for each LB. From left to right: temperature, LOS velocity, magnetic field strength, inclination, logarithm of the gas pressure, horizontal and vertical components of the J vector. For visualization purposes, the yellow contours delimit umbral pixels with Fe I 630.1 nm line core intensity < 0.25 Ic, qs (LB1 and LB2 panels) and < 0.12 Ic, qs (LB3 panels). Slits A–D mark the position of the vertical cuts shown in Figs. 8, 9, and 10. Each major tickmark represents 5″. No information was retrieved within the blank areas.
Current usage metrics show cumulative count of Article Views (full-text article views including HTML views, PDF and ePub downloads, according to the available data) and Abstracts Views on Vision4Press platform.
Data correspond to usage on the plateform after 2015. The current usage metrics is available 48-96 hours after online publication and is updated daily on week days.
Initial download of the metrics may take a while.