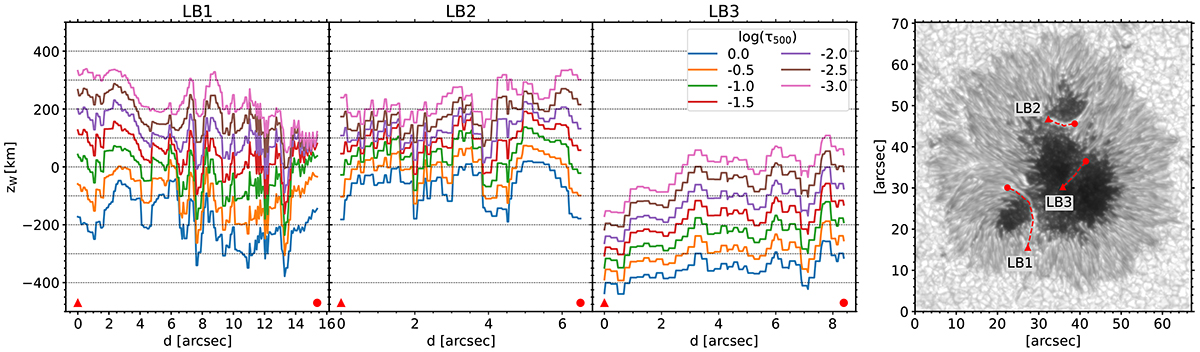
Fig. 4.
Download original image
Wilson depression at different optical depths along each LB. The Fe I 630.15 nm continuum intensity map shows the paths used to compute the Wilson depression for each LB and is saturated as the upper panel in Fig. 1. The triangular and circular markers indicate respectively the starting and ending points of the paths. The black dotted horizontal lines (left-hand plots) mark every 100 km.
Current usage metrics show cumulative count of Article Views (full-text article views including HTML views, PDF and ePub downloads, according to the available data) and Abstracts Views on Vision4Press platform.
Data correspond to usage on the plateform after 2015. The current usage metrics is available 48-96 hours after online publication and is updated daily on week days.
Initial download of the metrics may take a while.