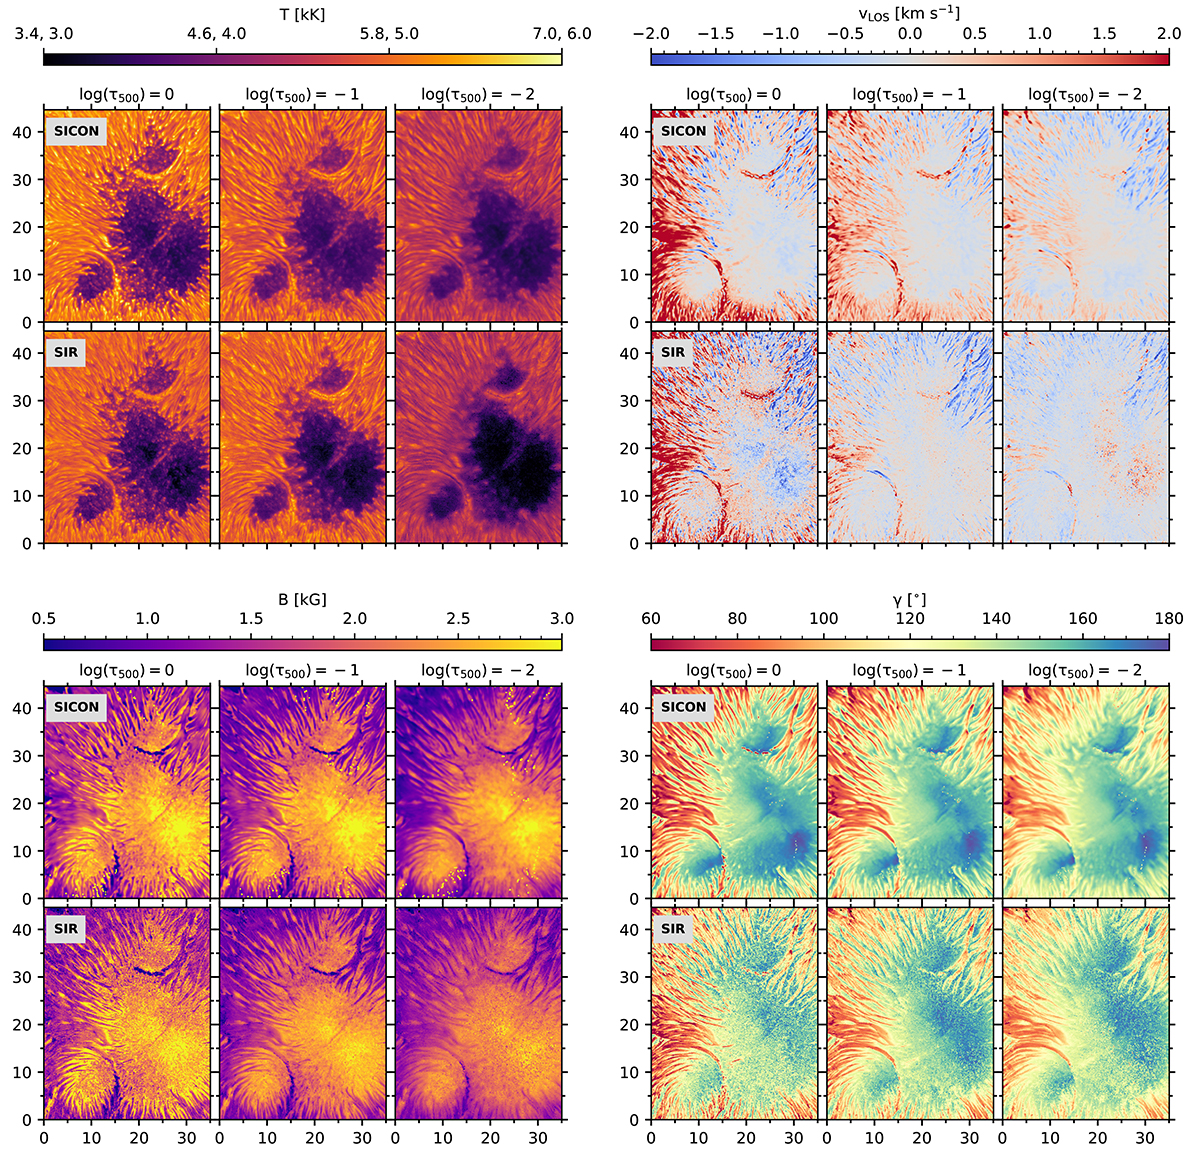
Fig. 2.
Download original image
Physical quantities retrieved with the SICON and SIR codes at log(τ500) = 0, −1, and −2 in a FOV hosting the analyzed LBs. The top panels show temperature and LOS velocity. The bottom panels show magnetic field strength and inclination. The temperature maps are saturated between 3.4 and 7 kK at log(τ500) = 0 and between 3 and 6 kK at log(τ500) = −1 and −2. The axes are represented in arcsec.
Current usage metrics show cumulative count of Article Views (full-text article views including HTML views, PDF and ePub downloads, according to the available data) and Abstracts Views on Vision4Press platform.
Data correspond to usage on the plateform after 2015. The current usage metrics is available 48-96 hours after online publication and is updated daily on week days.
Initial download of the metrics may take a while.