Open Access
Fig. 12.
Download original image
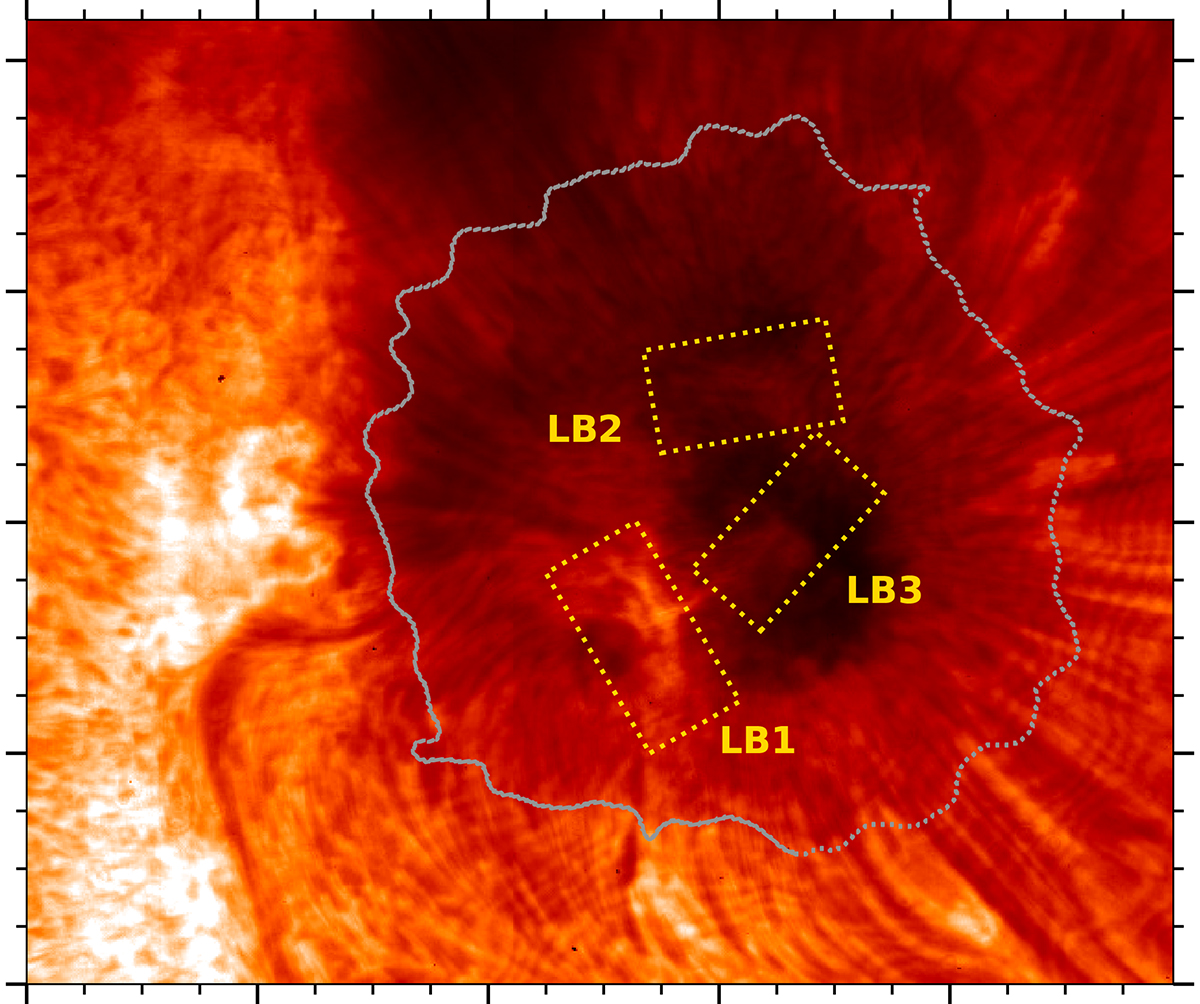
Context H-α image of the sunspot hosting the analyzed LBs at 19:06 UT. The yellow rectangles enclose each LB. The gray contour delimits the outer boundary of the sunspot, as seen in the Fe I 630.15 nm continuum intensity map. Each major tickmark represents 20″.
Current usage metrics show cumulative count of Article Views (full-text article views including HTML views, PDF and ePub downloads, according to the available data) and Abstracts Views on Vision4Press platform.
Data correspond to usage on the plateform after 2015. The current usage metrics is available 48-96 hours after online publication and is updated daily on week days.
Initial download of the metrics may take a while.