Open Access
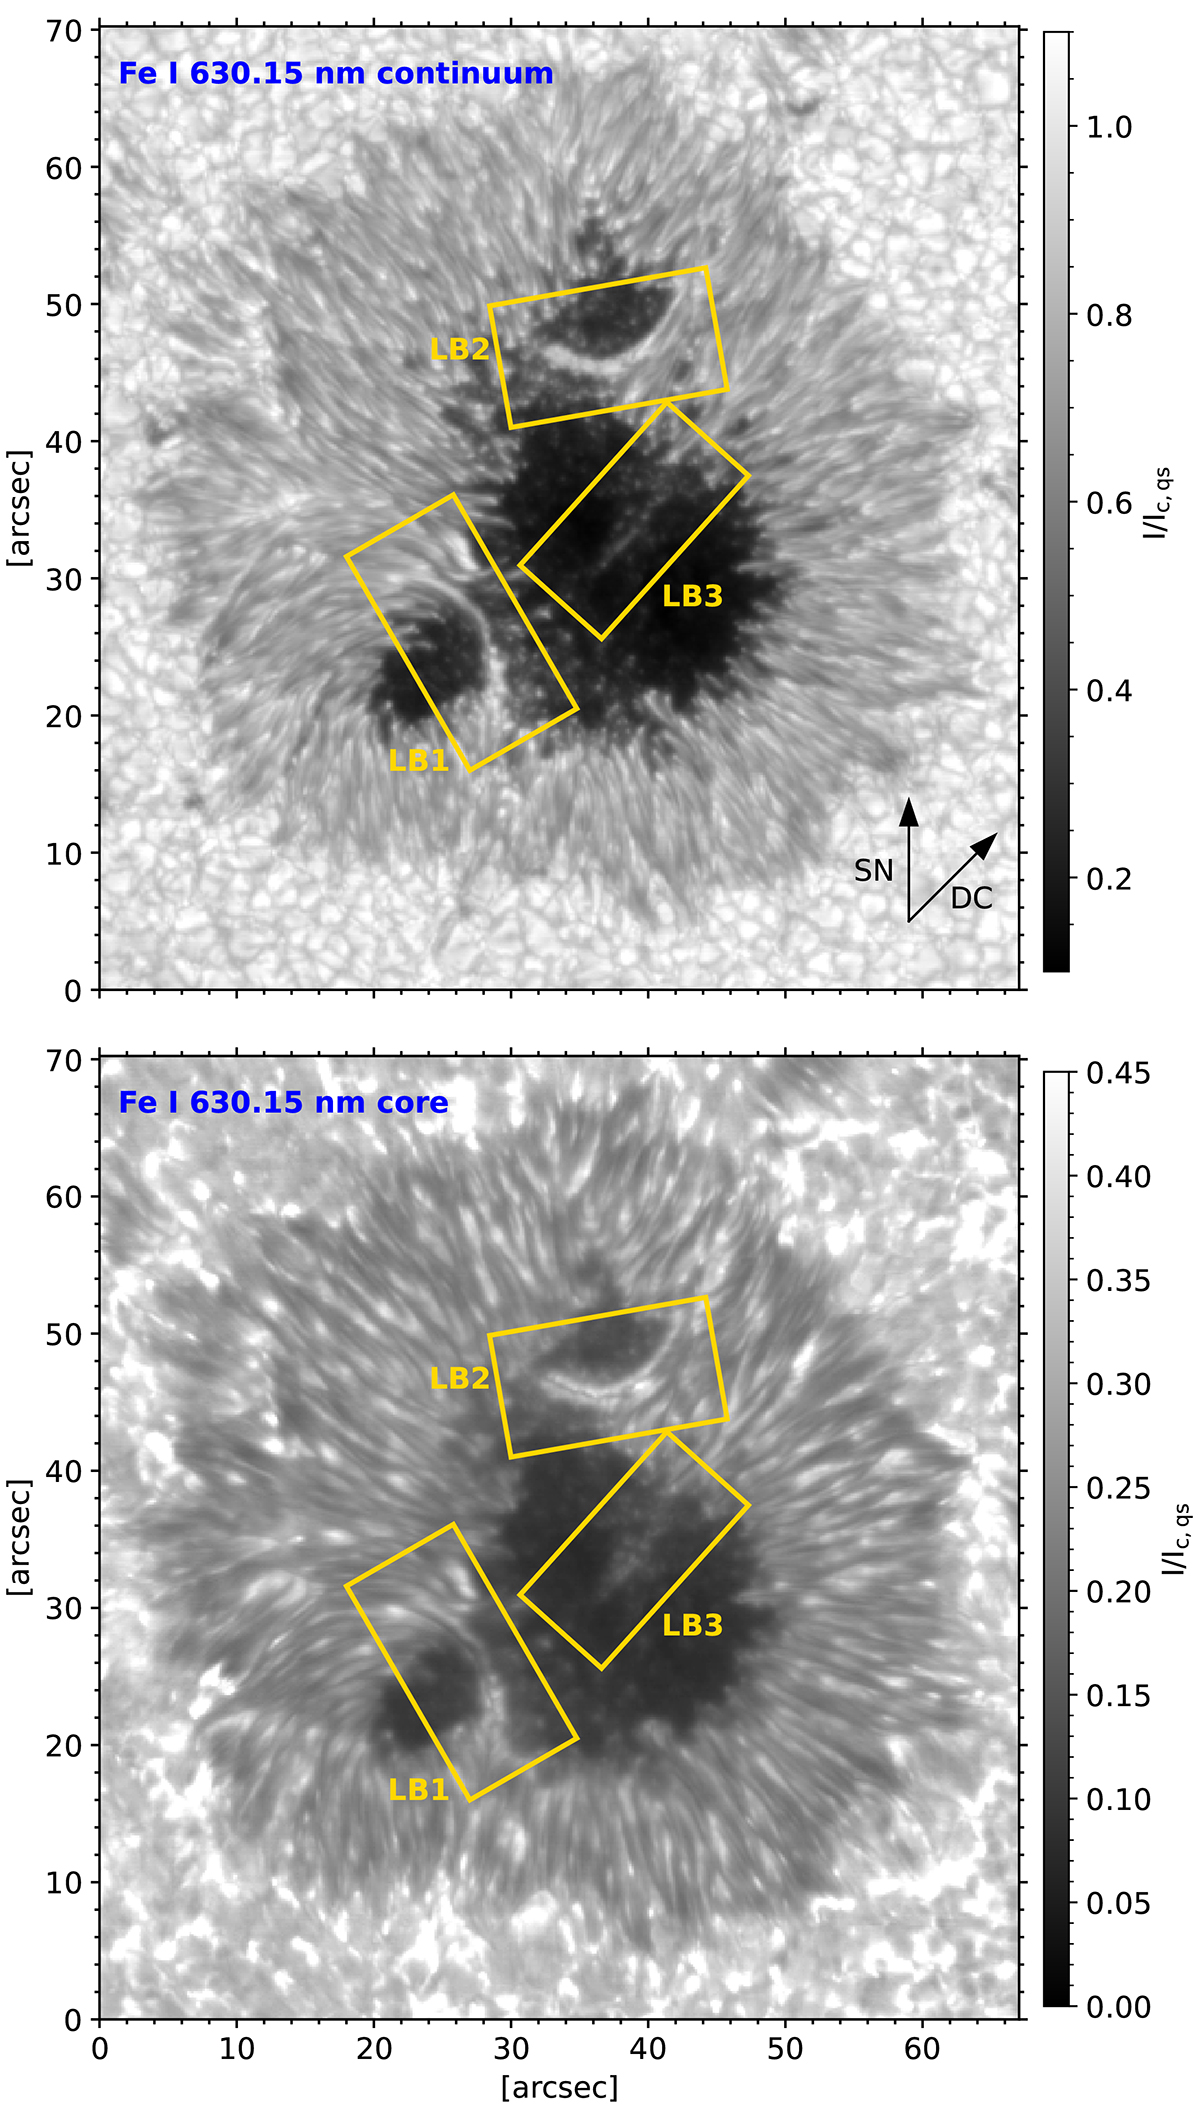
Fig. 1.
Download original image
Continuum and line core Fe I 630.15 nm intensity maps (upper and lower panel). The yellow rectangles enclose the analyzed LBs. The arrows in the upper panel point to the disk center (DC) and solar north (SN). Ic, qs refers to the continuum of the averaged quiet-Sun intensity.
Current usage metrics show cumulative count of Article Views (full-text article views including HTML views, PDF and ePub downloads, according to the available data) and Abstracts Views on Vision4Press platform.
Data correspond to usage on the plateform after 2015. The current usage metrics is available 48-96 hours after online publication and is updated daily on week days.
Initial download of the metrics may take a while.