Open Access
Fig. 2.
Download original image
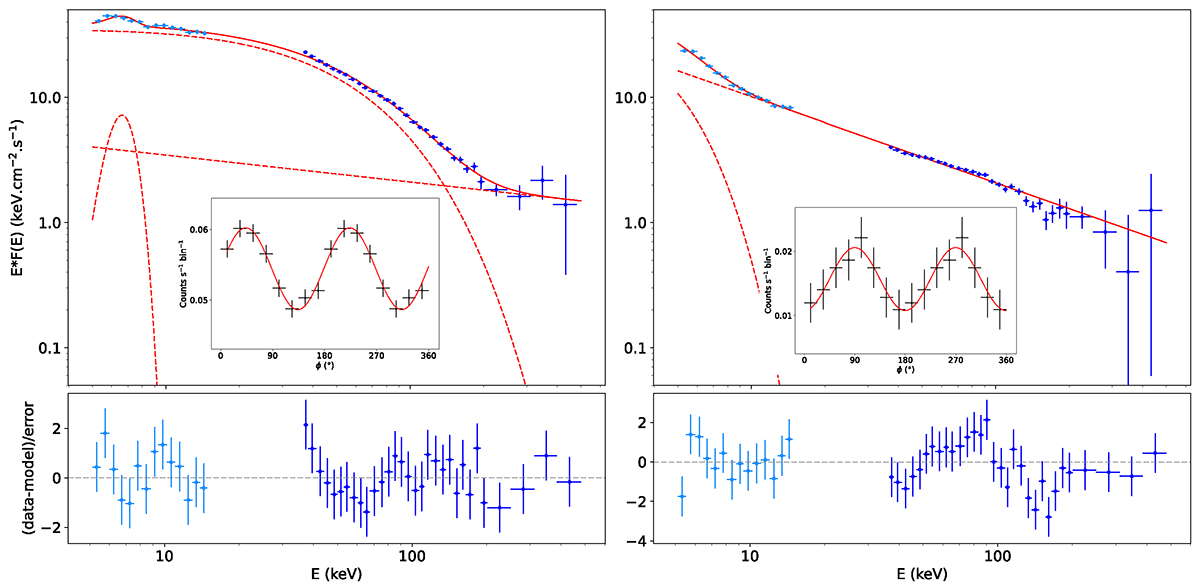
JEM-X (light blue) and ISGRI (dark blue) spectra. The continuous red lines show the total fit and the dashed red lines the various spectral components. The inserts show the 210–250 keV polarigrams, with the data points in black and the model in red. Left: Obs. 3 (HIMS). Right: Obs. 6 (SIMS).
Current usage metrics show cumulative count of Article Views (full-text article views including HTML views, PDF and ePub downloads, according to the available data) and Abstracts Views on Vision4Press platform.
Data correspond to usage on the plateform after 2015. The current usage metrics is available 48-96 hours after online publication and is updated daily on week days.
Initial download of the metrics may take a while.