Fig. 1.
Download original image
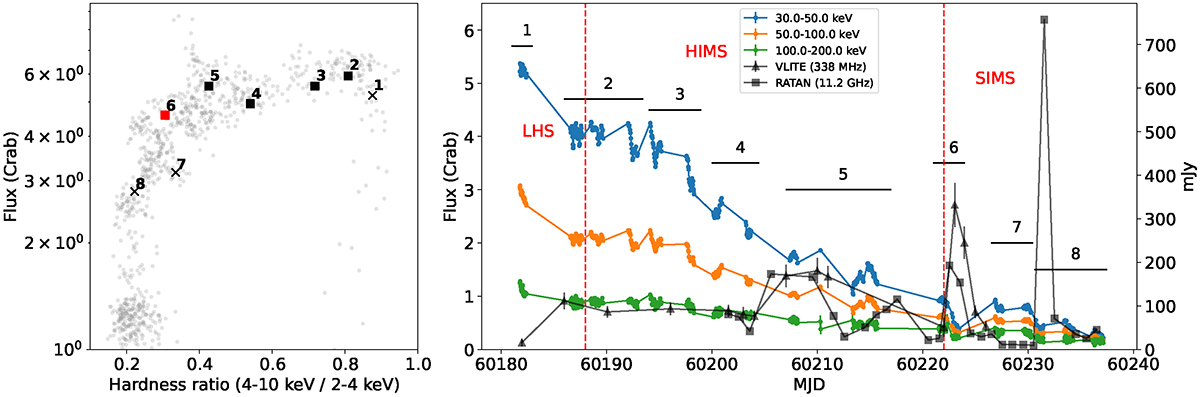
Evolution of J1727 outburst. Left: Hardness intensity diagrams from the MAXI/GSC data. Data points closest in time to INTEGRAL observations are highlighted as crosses for those with no polarization, and as black (respectively red) squares for those with a PA misaligned (respectively aligned) with the jet angle. Right: INTEGRAL/ISGRI ScW-based and radio (VLITE and RATAN) light curves of J1727. In both plots the numbers show the locations of our grouped observations.
Current usage metrics show cumulative count of Article Views (full-text article views including HTML views, PDF and ePub downloads, according to the available data) and Abstracts Views on Vision4Press platform.
Data correspond to usage on the plateform after 2015. The current usage metrics is available 48-96 hours after online publication and is updated daily on week days.
Initial download of the metrics may take a while.