Fig. 5.
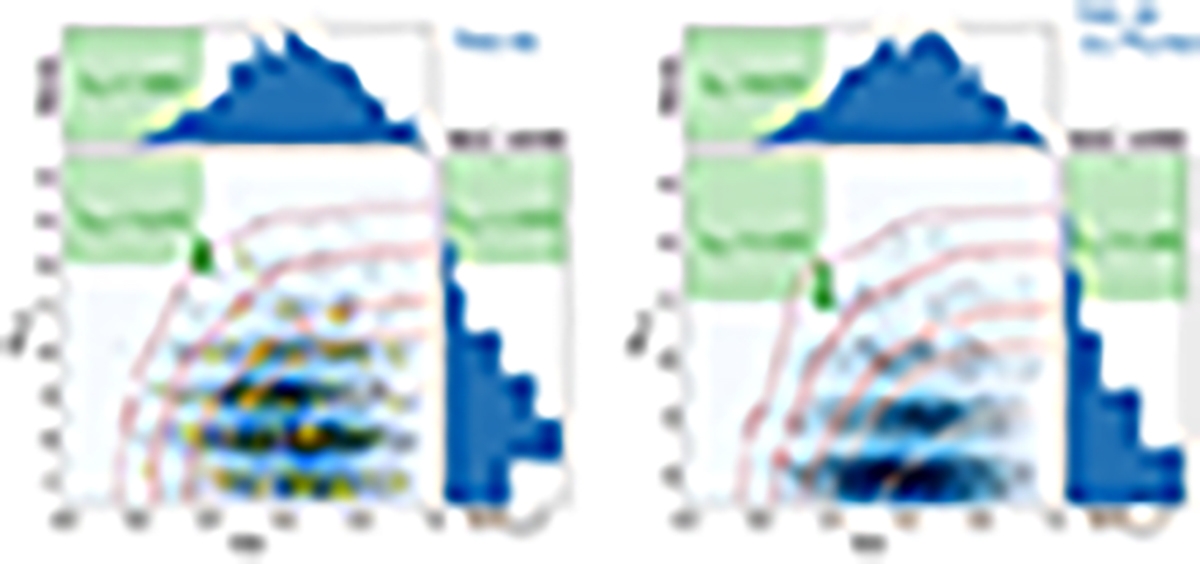
Download original image
Comparison of on-sky minor-to-major axis flattening b/a and number of kinematically correlated objects Ncorr for systems considering 14 satellites in the TNG50 simulation (left panel) and 13 satellites to consider the case without the newly discovered Plume (right panel), with the observed values for NGC 4490 (green star). Due to the lack of kinematic information for two of the observed objects, Ncorr = 12 out of 14 is only a lower limit, as indicated by the green arrow. Each simulated system is shown as a black cross (with small random offsets in the Ncorr to better illustrate the distribution despite this being a natural number), and their underlying distribution as a blue color map. Red contours indicate the fraction of systems more flattened and more kinematically correlated, in levels of 0.1, 1, 5, 10, and 33% of the simulated analogs. The fraction fboth of systems that are both as flattened (b/a < 0.38) and as kinematically correlated (Ncorr ≥ 12) are given in green. The distributions in b/a and Ncorr individually and fractions of analogs as extreme as the observed system in these quantities are also shown as histograms along the axes. Systems with an NGC 4485 analog close to the host are highlighted in yellow in the left panel.
Current usage metrics show cumulative count of Article Views (full-text article views including HTML views, PDF and ePub downloads, according to the available data) and Abstracts Views on Vision4Press platform.
Data correspond to usage on the plateform after 2015. The current usage metrics is available 48-96 hours after online publication and is updated daily on week days.
Initial download of the metrics may take a while.