Fig. 10.
Download original image
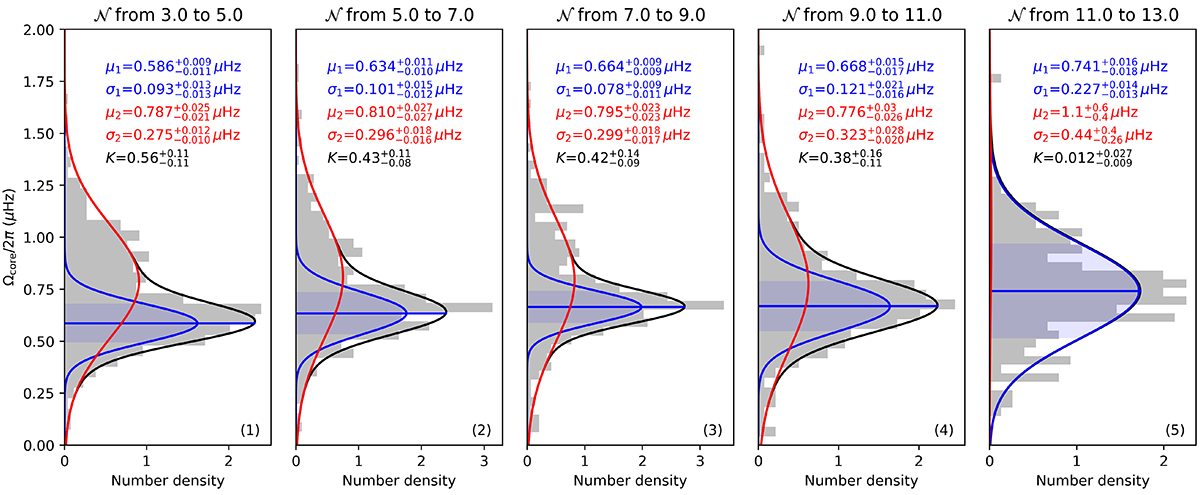
Two-Gaussian fit of the core rotation rate distributions in each bin of mixed mode density 𝒩. The grey histograms are the observed distributions of core rotation rates. The blue lines correspond to the first term on the right-hand side of Eq. (21), characterised by μ1 and σ1, which represent the over-density ridge. The blue horizontal lines and shaded areas illustrate the means and 1-σ regions of the over-density ridge in each bin. The red lines depict the second term on the right-hand side of Eq. (21), characterised by μ2 and σ2, representing the extended background. The black lines indicate the sum of the two Gaussian distributions, which provide a good reproduction of the observed histogram.
Current usage metrics show cumulative count of Article Views (full-text article views including HTML views, PDF and ePub downloads, according to the available data) and Abstracts Views on Vision4Press platform.
Data correspond to usage on the plateform after 2015. The current usage metrics is available 48-96 hours after online publication and is updated daily on week days.
Initial download of the metrics may take a while.