Fig. 12
Download original image
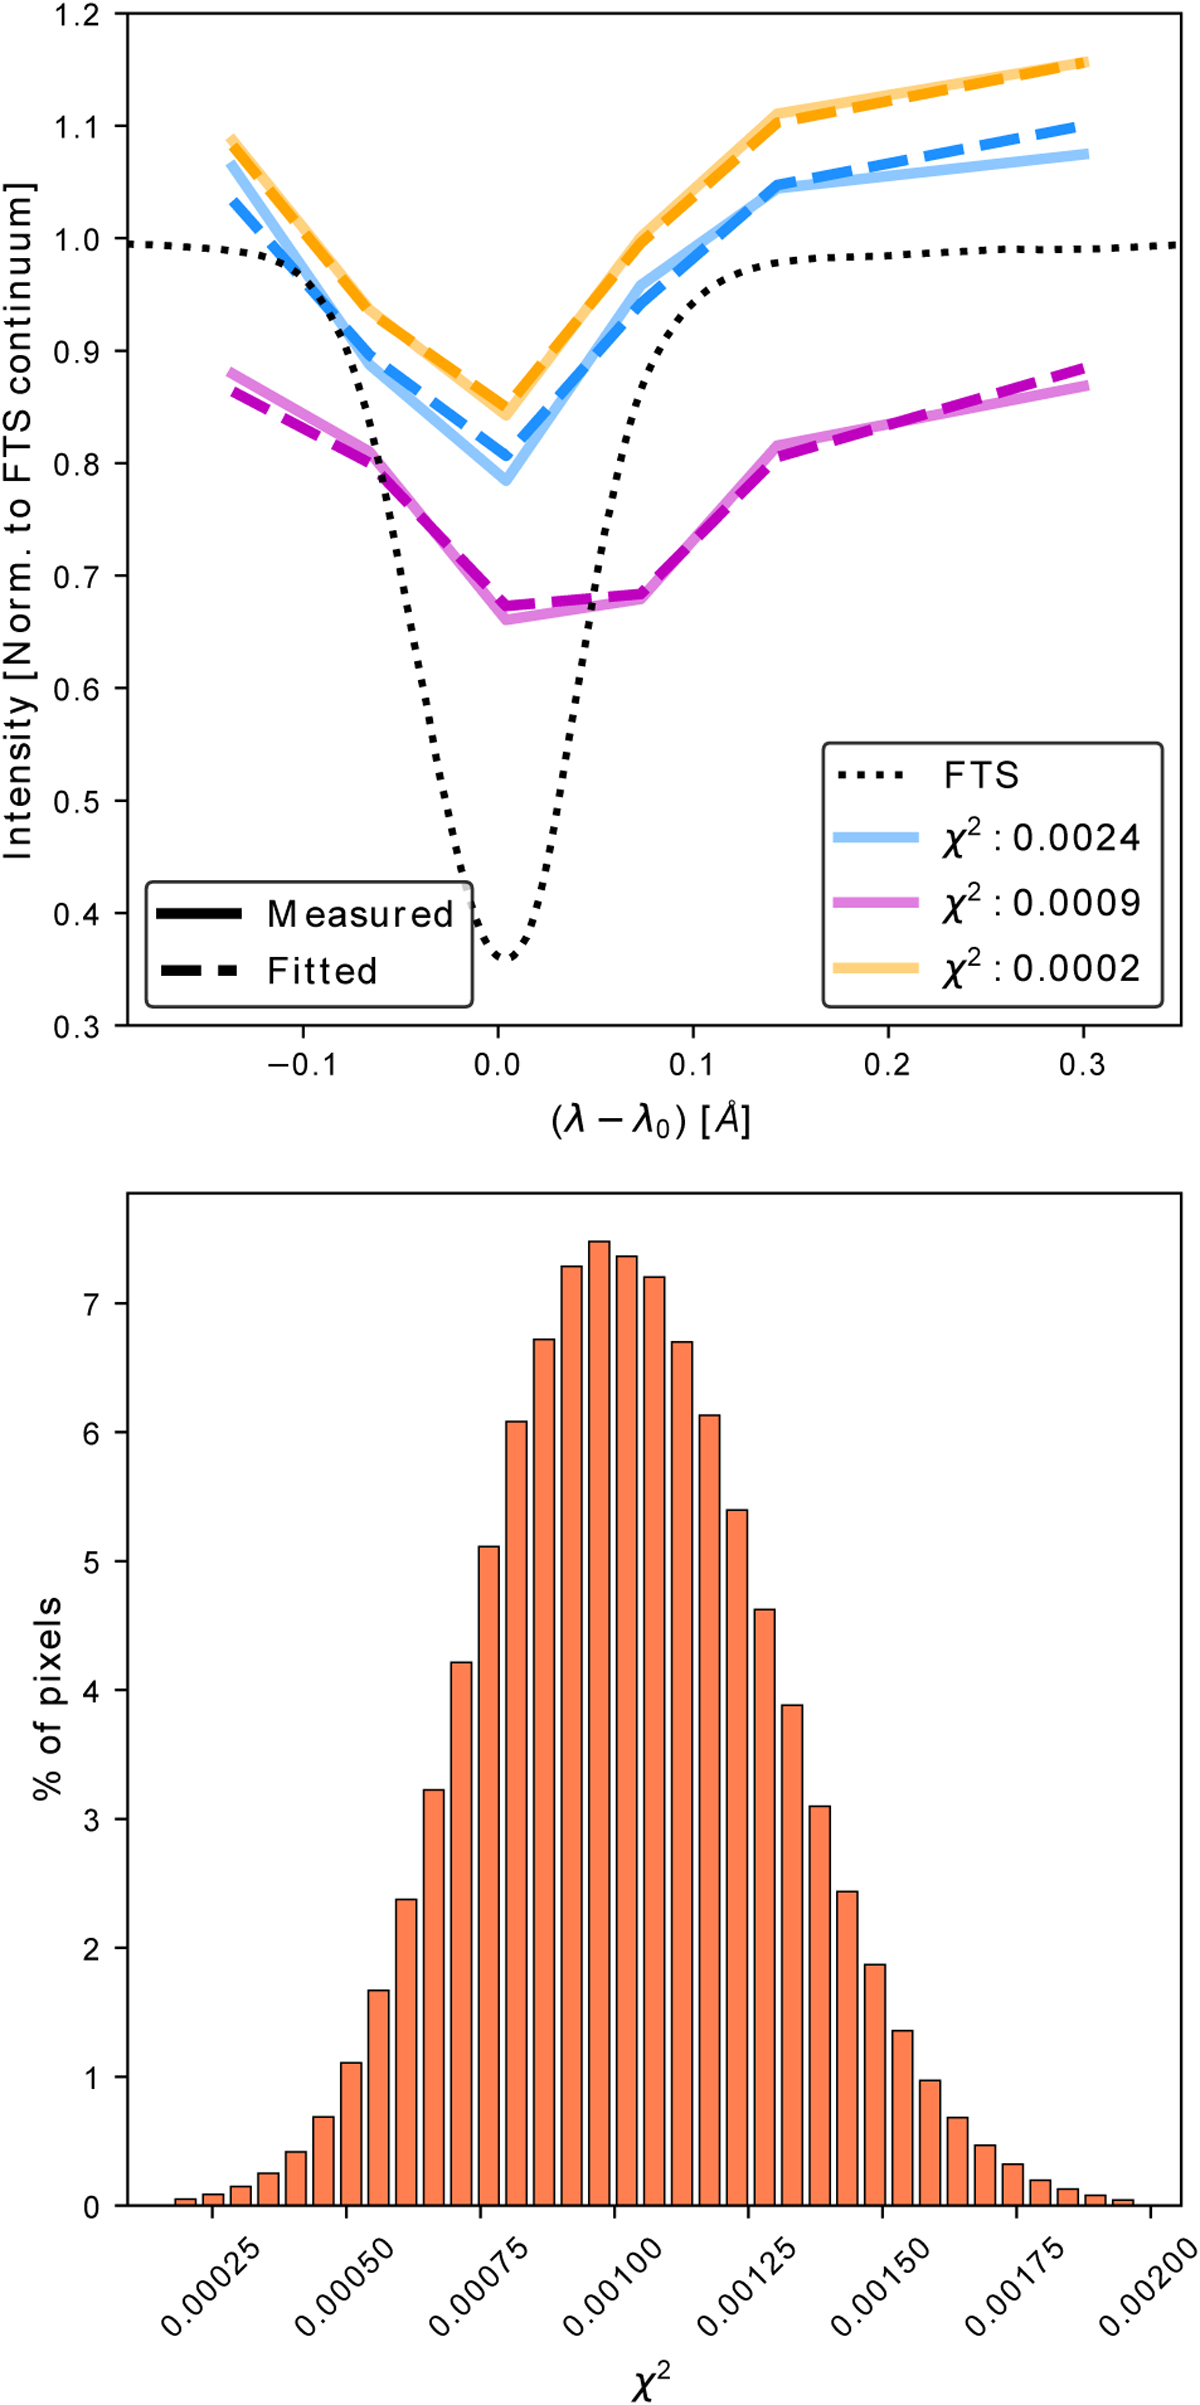
Comparison between the measured (solid lines) and fitted profiles (dashed lines) for three pixels, each representing varying degrees of accuracy (top panel). The FTS is shown as a reference. The bottom panel displays the distribution of χ2 values for all pixels. Among the three selected cases, one demonstrates an average fit (depicted in pink, with χ2 close to the mean value), while the other two correspond with extreme cases—one with a notably good fit and the other with a poor fit (depicted in yellow and blue, respectively). The value for χ2 has been computed employing Eq. (12).
Current usage metrics show cumulative count of Article Views (full-text article views including HTML views, PDF and ePub downloads, according to the available data) and Abstracts Views on Vision4Press platform.
Data correspond to usage on the plateform after 2015. The current usage metrics is available 48-96 hours after online publication and is updated daily on week days.
Initial download of the metrics may take a while.