Fig. 8.
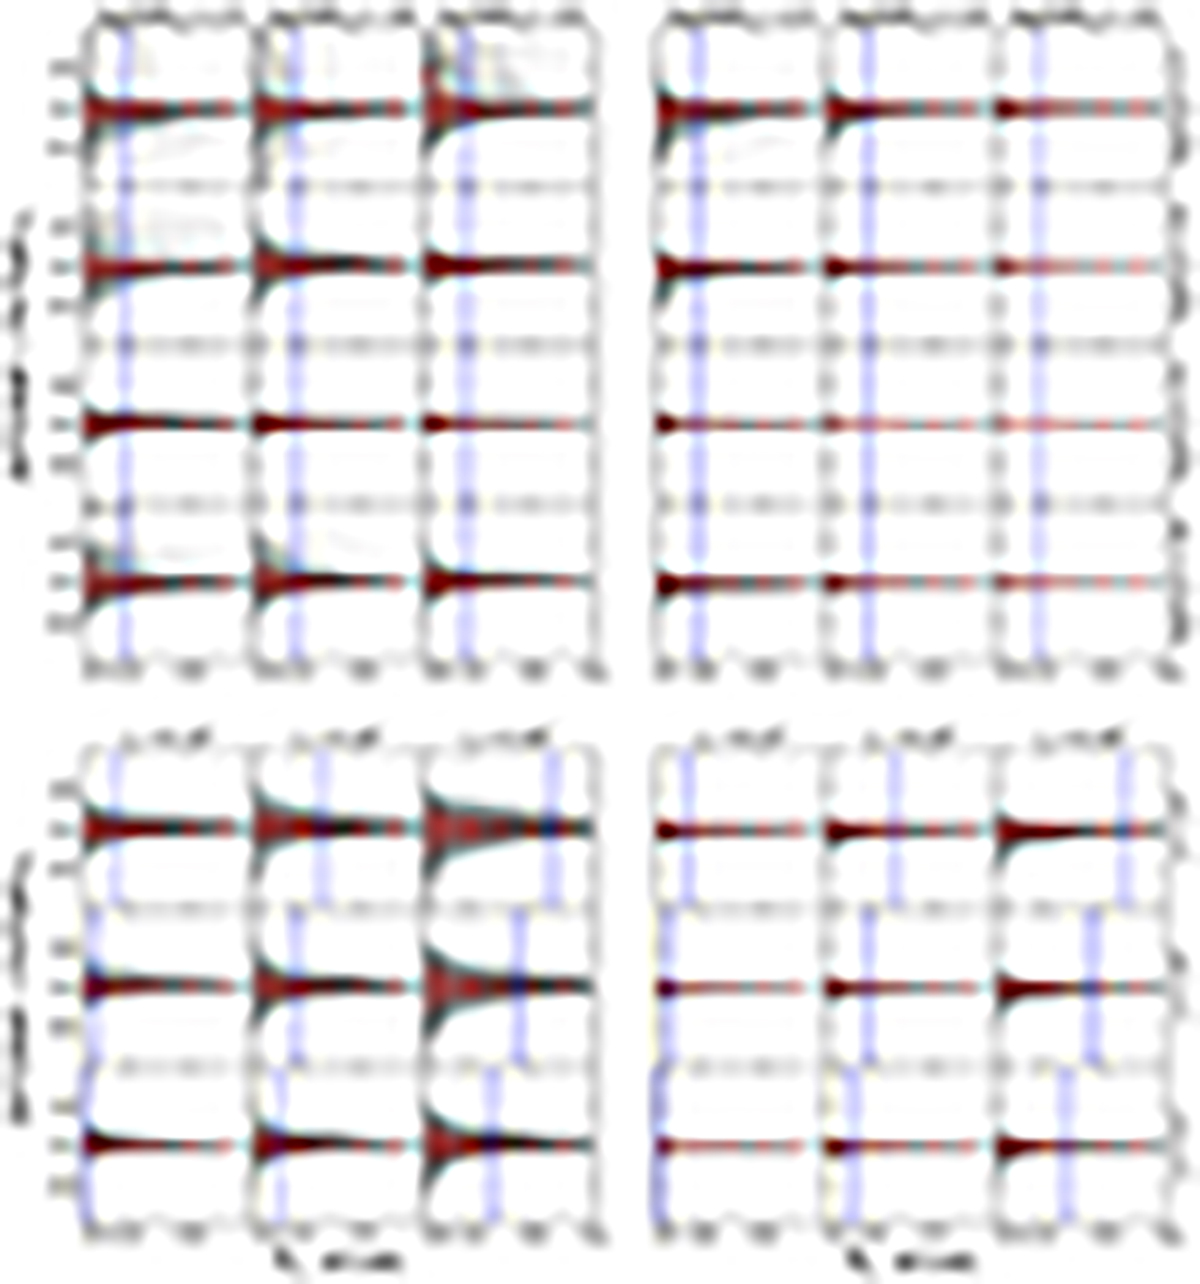
Download original image
Differences of F336W − F475W, when measured through T and C apertures. The differences are shown as grey lines. The X-axis – the radius of C aperture. The T aperture radius of RT = 3.0 arcsec is used. Red markers show the median difference for a given RC, error bars mark the 16th and 84th percentiles. The blue vertical lines mark radial distances equal to double half-light radii, 2⋅R50. The top-row panels show differences depending on cluster mass and age (the cluster radial profile parameters are rc = 0.2 arcsec and γ = 2.8); meanwhile, the bottom panels show differences depending on radial profile parameters (the clusters of log(M/M⊙) = 3.0 and log(t/yr) = 8.0). Panel blocks on the left show results when all stars are measured, while the panel blocks on the right show results when PMS stars are subtracted from the aperture photometry results.
Current usage metrics show cumulative count of Article Views (full-text article views including HTML views, PDF and ePub downloads, according to the available data) and Abstracts Views on Vision4Press platform.
Data correspond to usage on the plateform after 2015. The current usage metrics is available 48-96 hours after online publication and is updated daily on week days.
Initial download of the metrics may take a while.