Open Access
Fig. 3.
Download original image
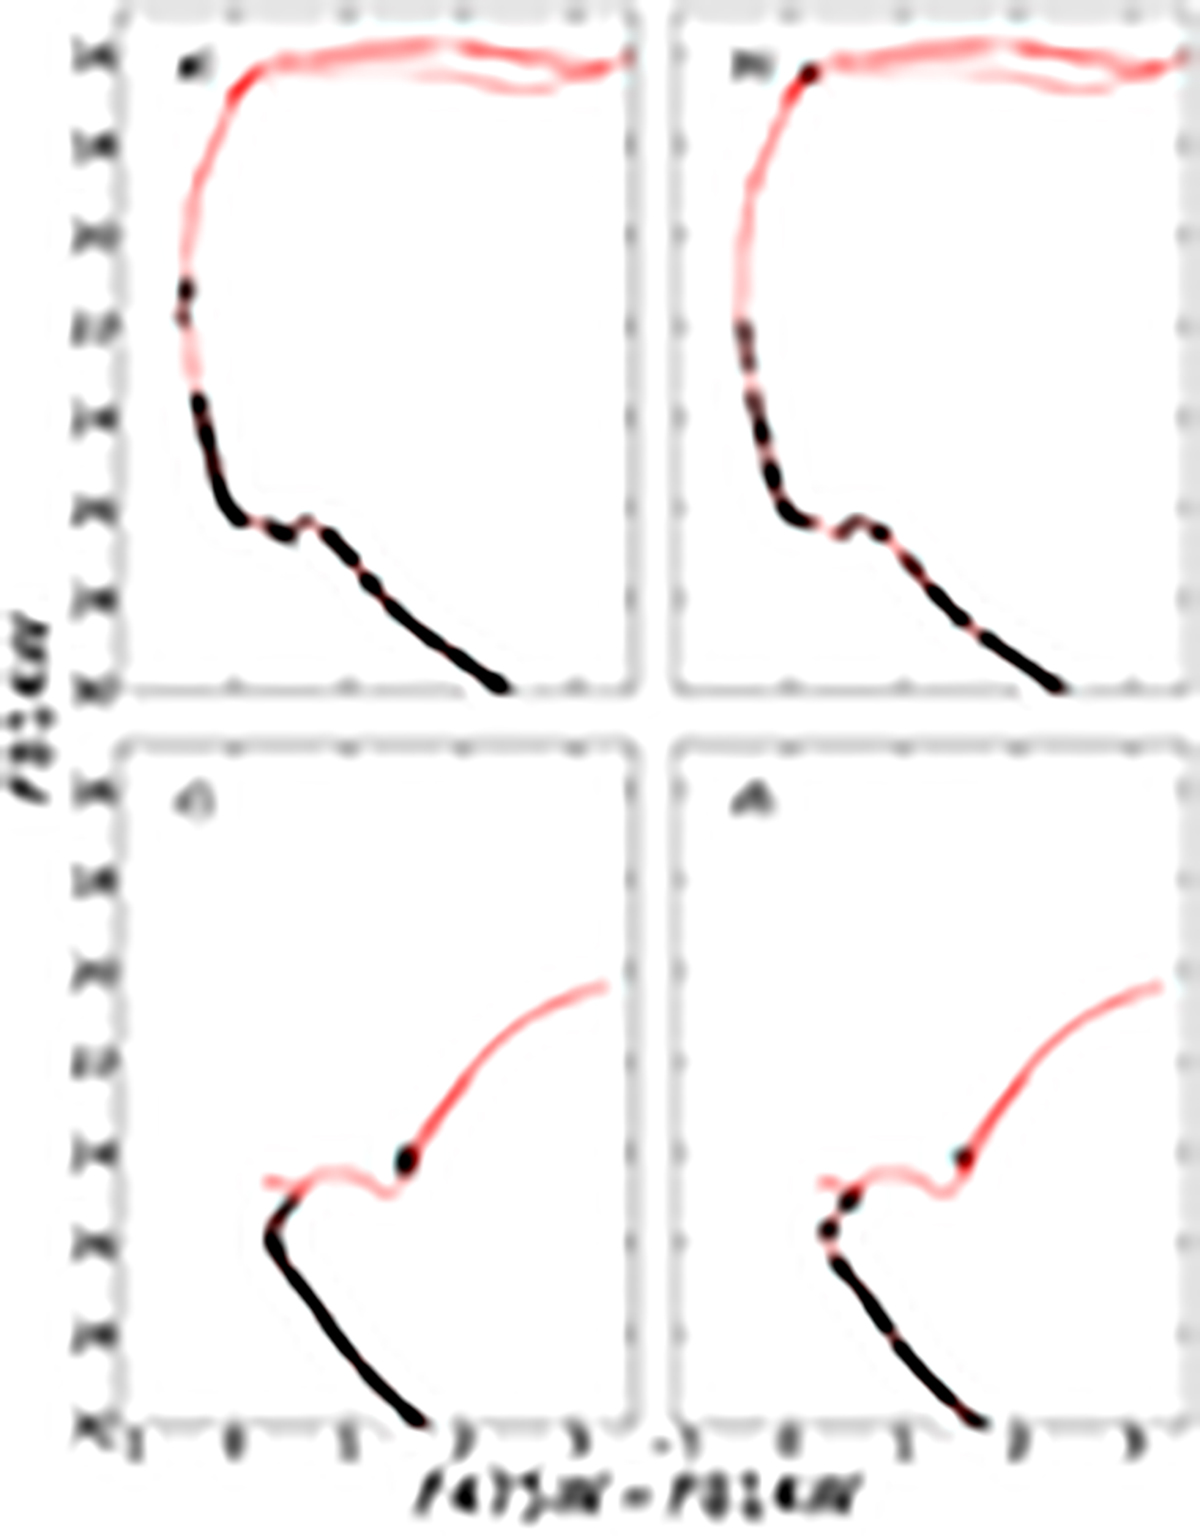
CMDs of two simulated clusters of mass log(M/M⊙) = 2.5 and of age log(t/yr) = 7.0 (upper row) and log(t/yr) = 9.0 (bottom row). The generation in the left column is the same as shown in Fig. 1c, meanwhile the right column matches Fig. 1d. Red lines mark PARSEC-COLIBRI isochrones. Open circles – individual stars.
Current usage metrics show cumulative count of Article Views (full-text article views including HTML views, PDF and ePub downloads, according to the available data) and Abstracts Views on Vision4Press platform.
Data correspond to usage on the plateform after 2015. The current usage metrics is available 48-96 hours after online publication and is updated daily on week days.
Initial download of the metrics may take a while.