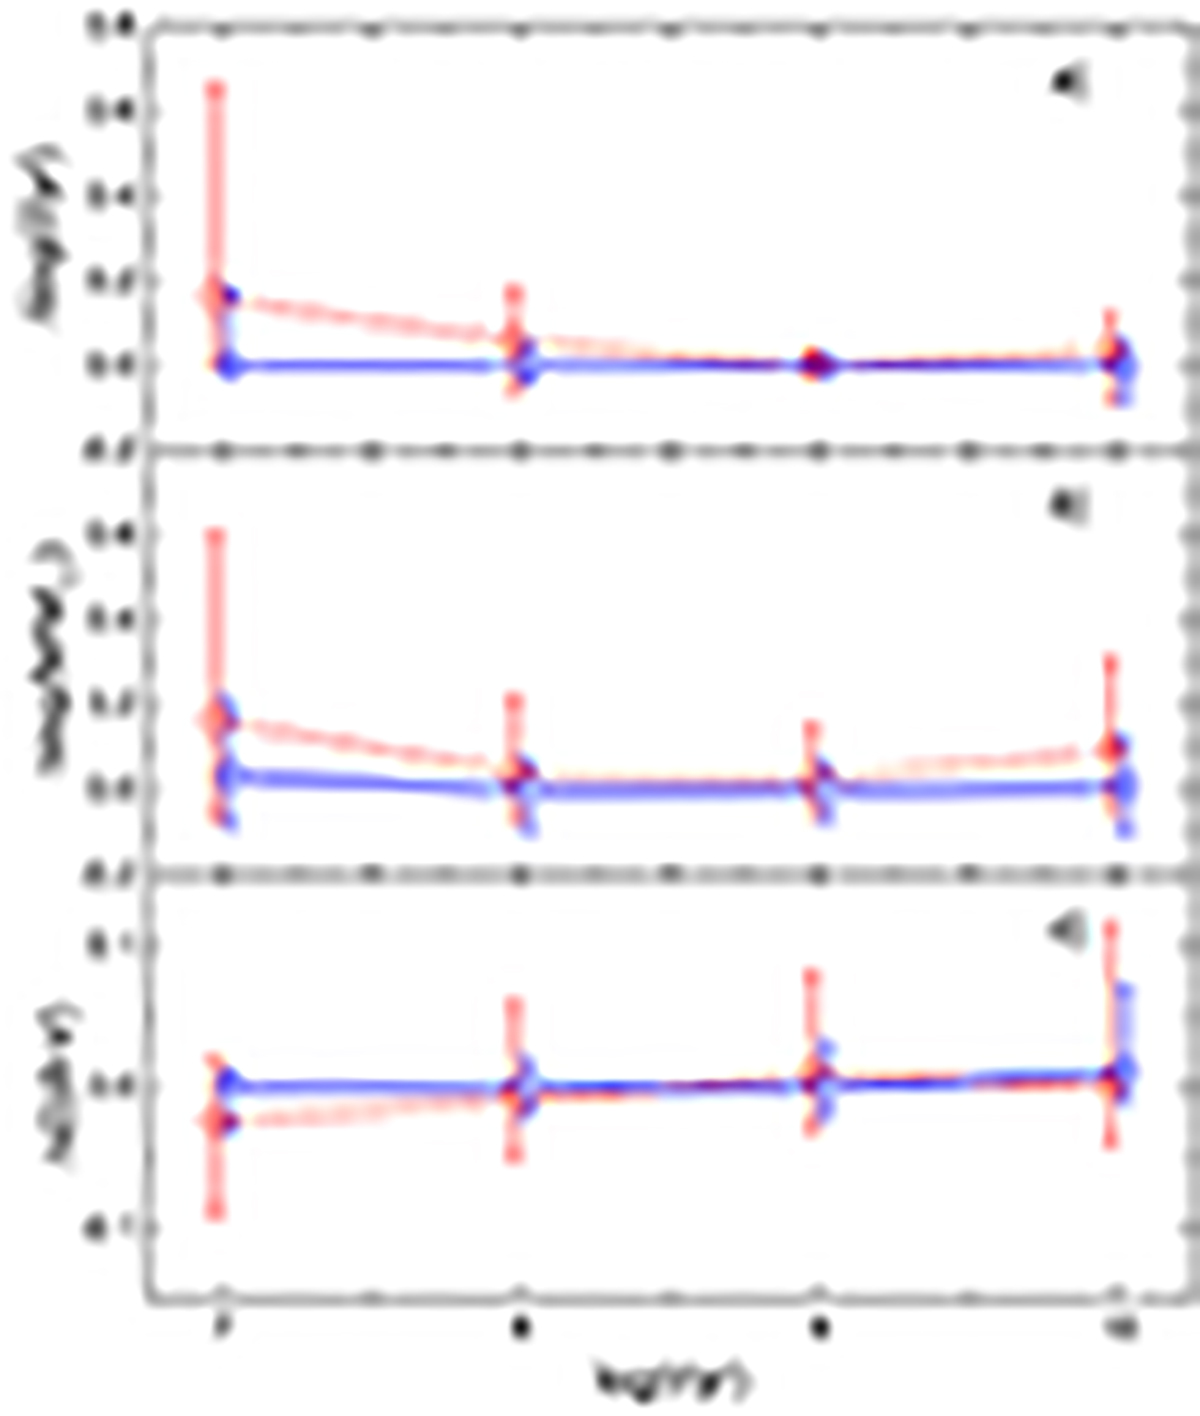
Fig. 11.
Download original image
Results of star cluster physical parameter determination tests. The provided differences are between the determined and input parameter values. Panel a) shows the median of age differences; b) – the median of mass differences; c) – the median of colour excess, E(B − V), differences. Red open circles mark median values of parameter differences determined based on the measurements through the aperture of Rap = 0.5 arcsec. Blue open circles mark median values of parameter differences determined based on the measurements through the apertures of Rap = 1.0, 2.0, and 7.0 arcsec, and then merged into a single dataset. Error bars show the 16–84 percentile ranges. Markers and corresponding lines are slightly shifted along the X-axis around the original input value for visual clarity.
Current usage metrics show cumulative count of Article Views (full-text article views including HTML views, PDF and ePub downloads, according to the available data) and Abstracts Views on Vision4Press platform.
Data correspond to usage on the plateform after 2015. The current usage metrics is available 48-96 hours after online publication and is updated daily on week days.
Initial download of the metrics may take a while.