Open Access
Fig. 9
Download original image
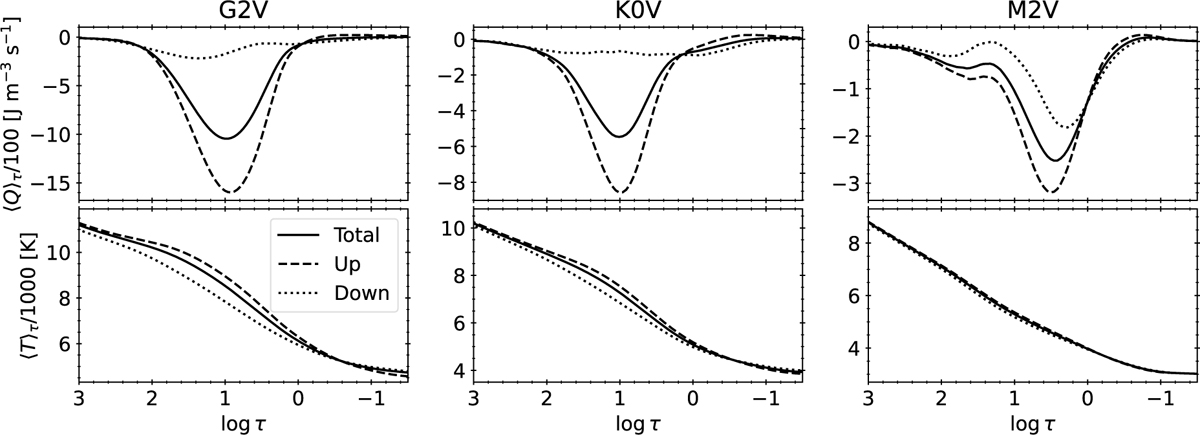
Mean of the radiative energy exchange rate Q (top row) and temperature (bottom) over the iso-τ surfaces for the entire domain (solid line) and separated for upflows (dotted) and downflows (dashed). The results are shown for the last snapshot of the time series of the G2V (left column), K0V (middle), and M2V (right) star.
Current usage metrics show cumulative count of Article Views (full-text article views including HTML views, PDF and ePub downloads, according to the available data) and Abstracts Views on Vision4Press platform.
Data correspond to usage on the plateform after 2015. The current usage metrics is available 48-96 hours after online publication and is updated daily on week days.
Initial download of the metrics may take a while.