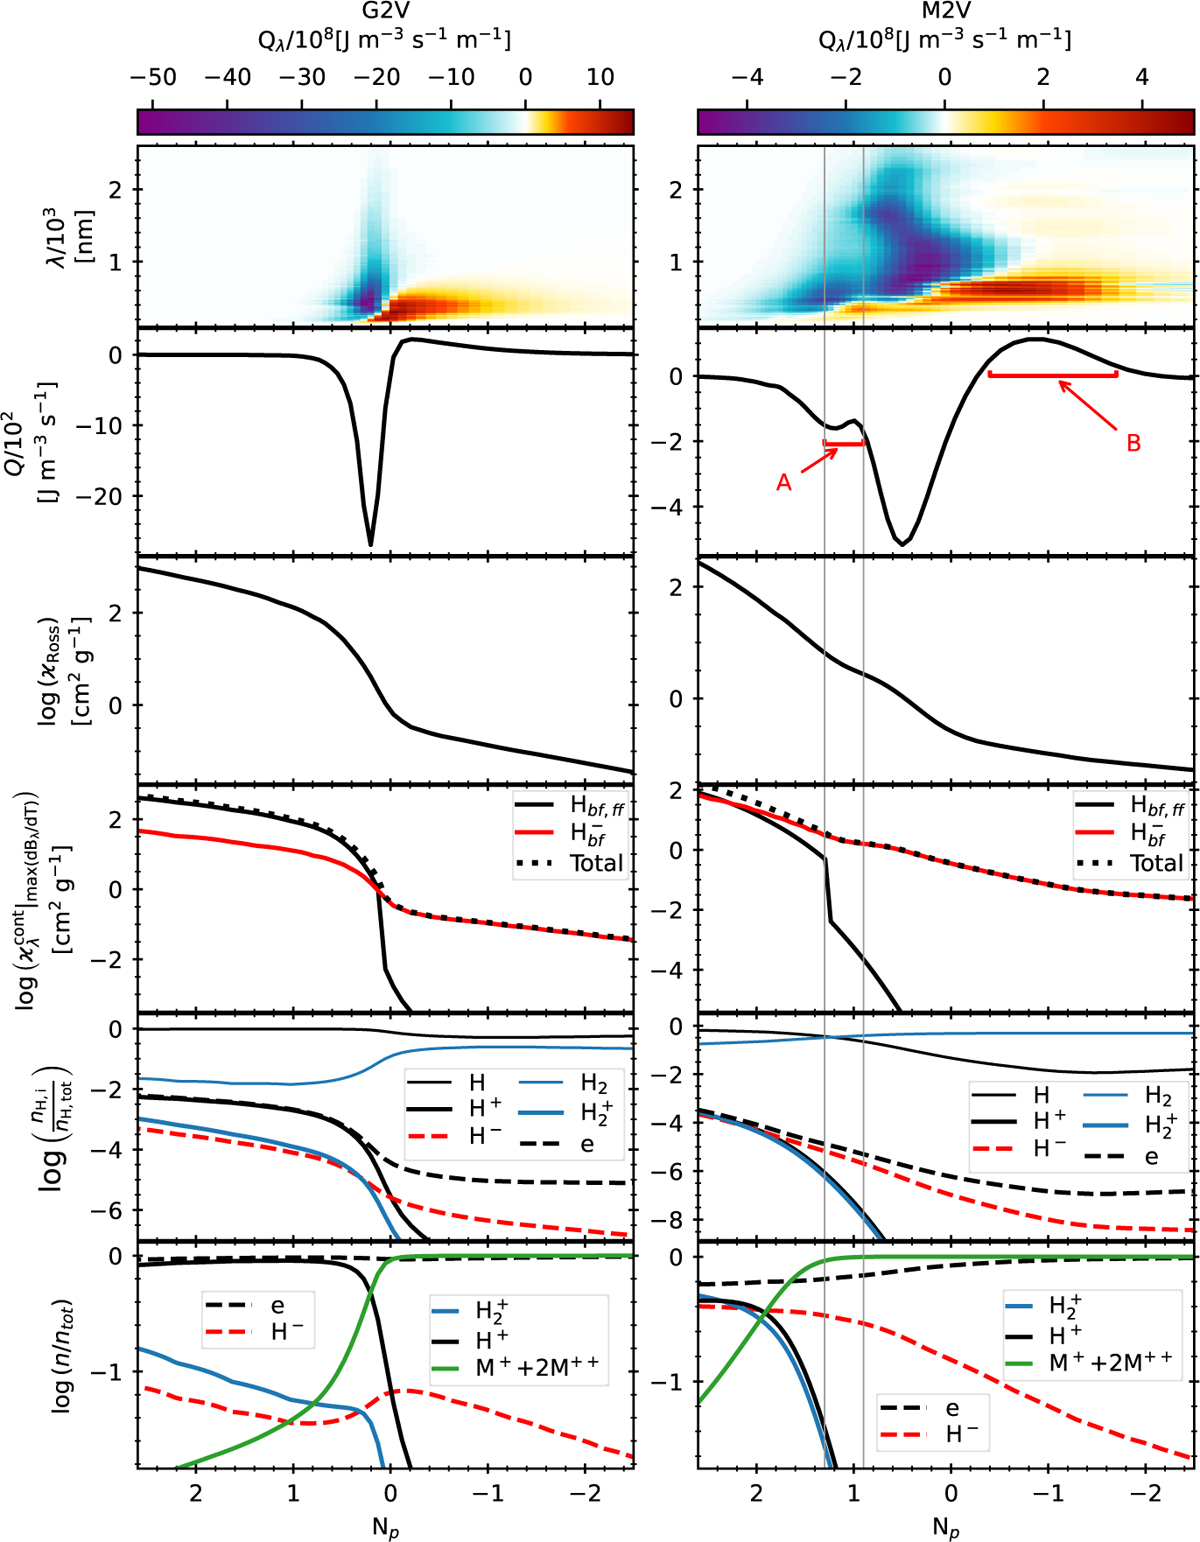
Fig. 8

Download original image
Variation with Np of the radiative energy exchange rate, opacity, nuclei conservation, and charge conservation for the G2V (left column) and M2V (right) stars for the last snapshot in their time series. The top row shows the 2D colour-map of the monochromatic Qλ computed with the ODF withing each λ-step (∑i,j Qi,j ωj in the notation of Paper I). The vertical axes of this row show the wavelength. The corresponding colour-bar located over each panel ranges from min Qλ to max Qλ, and displays the negative Qλ (i.e. cooling) in purple-blue tones and the positive Qλ (i.e. heating) in red-yellow tones. The second and third rows show the bolometric Q and logarithm of Rosseland opacity, respectively. The fourth row shows the logarithm of the monochromatic opacity at the wavelength where the derivative of the Planck function dBλ/dT is maximum for the total continuum opacity (black dots) and its two main contributors, bound-free plus free-free transitions for neutral hydrogen (solid black line) and bound-free transitions for H− (solid red line). The discontinuity in the opacity of neutral hydrogen corresponds to the shift through its first ionization edge. The fifth row shows the nuclei conservation of hydrogen as the logarithm of the ratio of the number density of each H specie and the total number of H nuclei. The same ratio is also shown for the electrons (dashed black line). The bottom row shows the charge conservation as the logarithm of the ratio of the number density of the charges from each specie and the total number of negative charges. The species are specified in the legend. The electrons coming from ionization of atoms with atomic number Z > 1 (i.e. metals M) are labelled as M+ + 2M++. In all the panels of the right column, the range Np ∊ [0.9, 1.3] is marked by two vertical grey lines.
Current usage metrics show cumulative count of Article Views (full-text article views including HTML views, PDF and ePub downloads, according to the available data) and Abstracts Views on Vision4Press platform.
Data correspond to usage on the plateform after 2015. The current usage metrics is available 48-96 hours after online publication and is updated daily on week days.
Initial download of the metrics may take a while.


