Fig. 7
Download original image
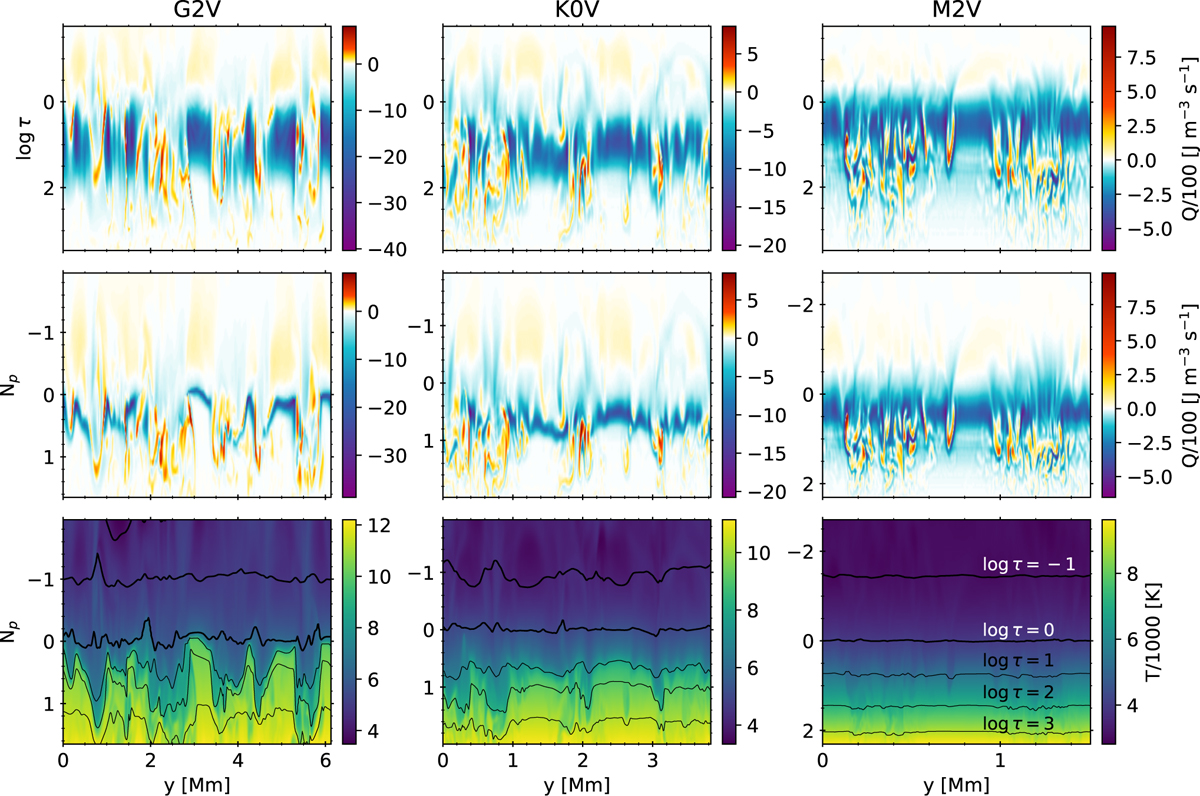
Radiative energy exchange rate Q (top and middle row) and temperature (bottom row) for the same vertical cut as in Fig. 5 in the last snapshot of the time series of the three spectral types (different columns). The vertical cut is shown with the geometrical coordinate y in the horizontal axis, and the logarithm of the Rosseland optical depth (top row) and the number of pressure scale heights (middle and bottom rows) in the vertical axis. Both depth scales show the same vertical extension. In the bottom row, the iso-τ surfaces are shown in thick solid black (log τ ≤ 0) and thin solid black (log τ > 0) lines, with ∆ log τ = 1.
Current usage metrics show cumulative count of Article Views (full-text article views including HTML views, PDF and ePub downloads, according to the available data) and Abstracts Views on Vision4Press platform.
Data correspond to usage on the plateform after 2015. The current usage metrics is available 48-96 hours after online publication and is updated daily on week days.
Initial download of the metrics may take a while.