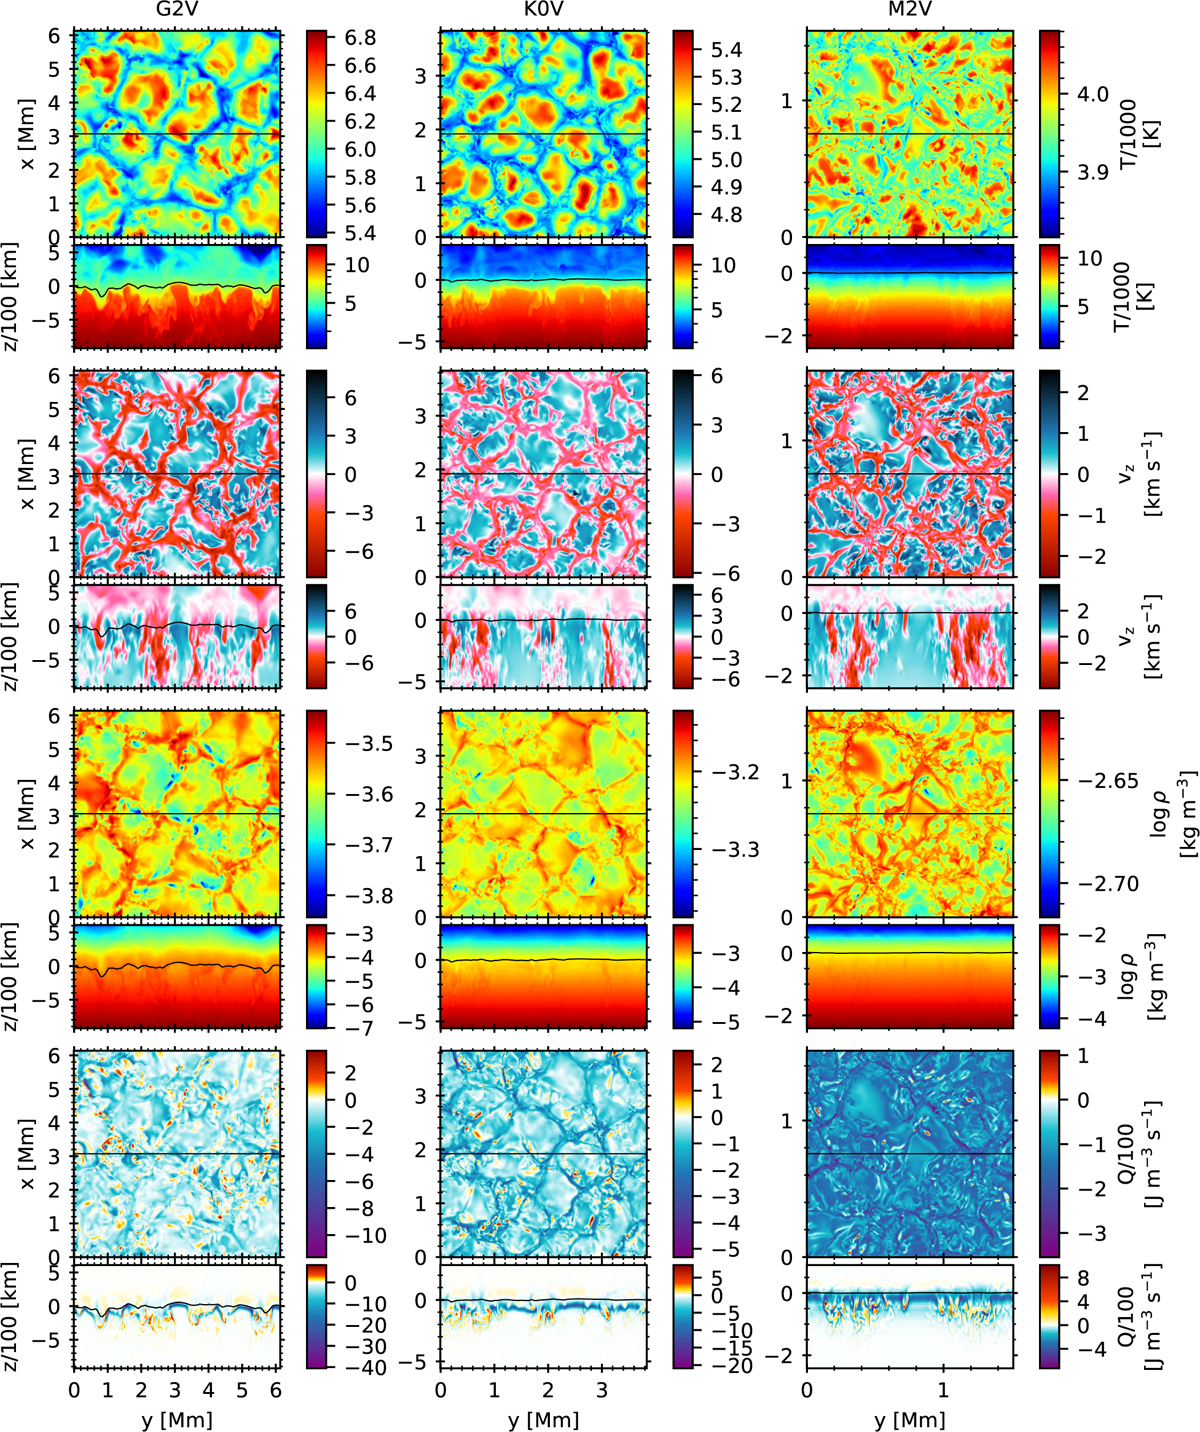
Fig. 5
Download original image
Temperature (top pair of rows), vertical velocity (second pair), logarithm of density (third), and Q rate (bottom) of the last snapshot of the time series of the G2V (left column), K0V (middle), and M2V (right) stars. The values of the quantities shown in the colour maps are indicated by the corresponding colour-bars. The upper panel of each pair of rows shows the surface at τ = 1; the lower panel, a vertical cut at the middle of the snapshot. Similarly to Fig. 3, the location of the iso-τ surface and the vertical cut are shown as solid curves.
Current usage metrics show cumulative count of Article Views (full-text article views including HTML views, PDF and ePub downloads, according to the available data) and Abstracts Views on Vision4Press platform.
Data correspond to usage on the plateform after 2015. The current usage metrics is available 48-96 hours after online publication and is updated daily on week days.
Initial download of the metrics may take a while.