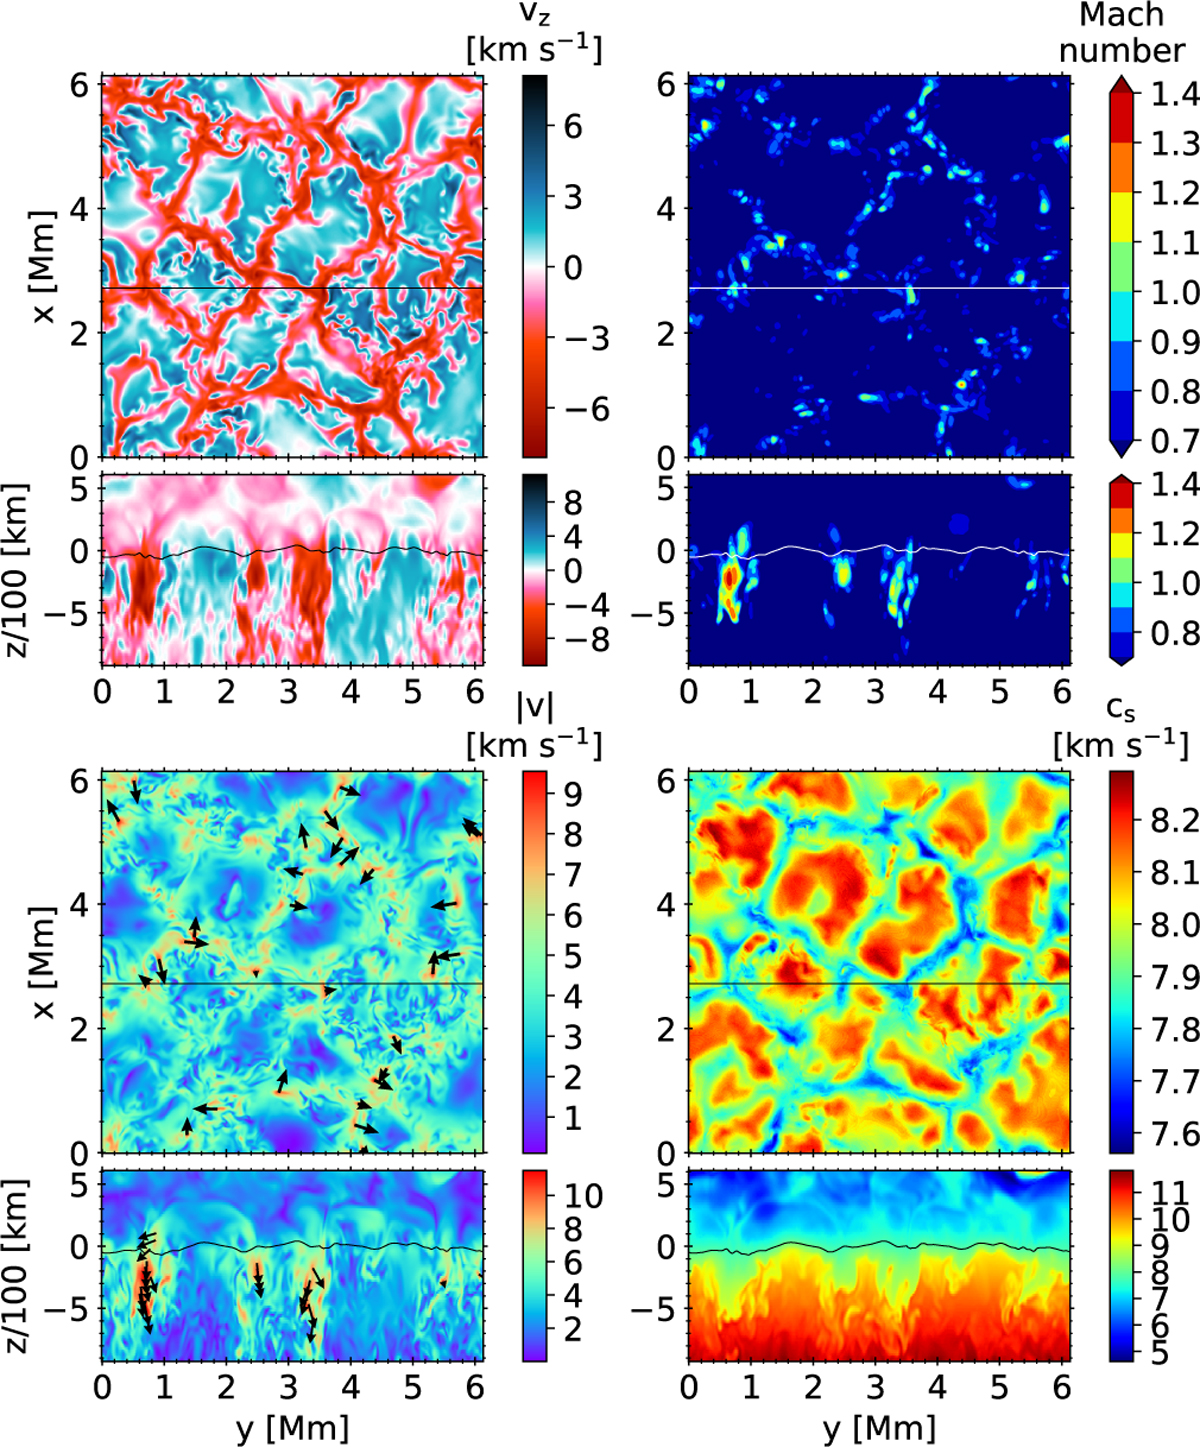
Fig. 3
Download original image
Colour maps of the vertical velocity (top left quadrant), the Mach number (top right quadrant), the modulus of velocity (bottom left quadrant), and the sound speed (bottom right quadrant) of the last snapshot of the time series of the G2V star. Each quadrant shows the τ = 1 surface (top panel) and a vertical cut at x = 2.72 Mm (bottom panel). The location of the τ = 1 surface is shown with a solid curve in the bottom panel of every quadrant and the location of the vertical cut is shown as a solid horizontal line in the top panel. The values of the mapped quantities are shown in the corresponding colour-bar positioned next to each panel. In the top right quadrant the green, yellow, orange, and red colours correspond to supersonic Mach numbers. The velocity direction at the supersonic flows is indicated by black arrows in the panels of the bottom left quadrant (projected in the τ = 1 surface and the vertical plane).
Current usage metrics show cumulative count of Article Views (full-text article views including HTML views, PDF and ePub downloads, according to the available data) and Abstracts Views on Vision4Press platform.
Data correspond to usage on the plateform after 2015. The current usage metrics is available 48-96 hours after online publication and is updated daily on week days.
Initial download of the metrics may take a while.