Fig. 18
Download original image
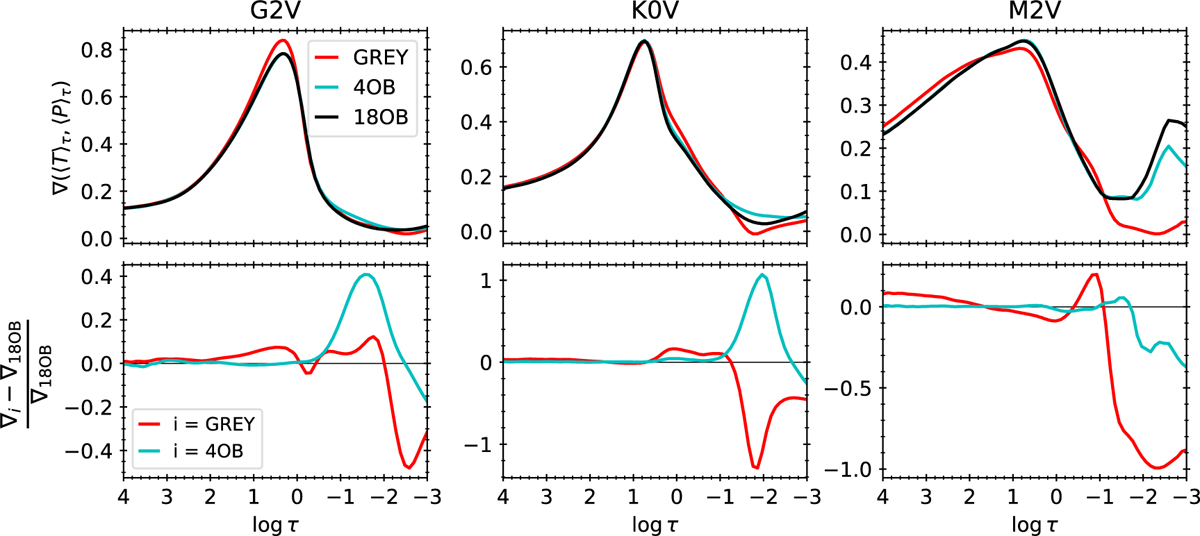
Temperature gradient averaged over time of the G2V (left column), K0V (middle), and M2V (right) stars. Top row: mean temperature gradient ∇ = ∂ ln〈T〉τ/∂ ln〈p〉τ computed from the mean stratification of temperature and pressure of the simulations run using the 18OB (black curve), 4OB (blue), and grey (red) opacity setups. Bottom row: relative difference of ∇ computed with 4OB (blue curve) and grey (red) compared to ∇ obtained using 18OB.
Current usage metrics show cumulative count of Article Views (full-text article views including HTML views, PDF and ePub downloads, according to the available data) and Abstracts Views on Vision4Press platform.
Data correspond to usage on the plateform after 2015. The current usage metrics is available 48-96 hours after online publication and is updated daily on week days.
Initial download of the metrics may take a while.