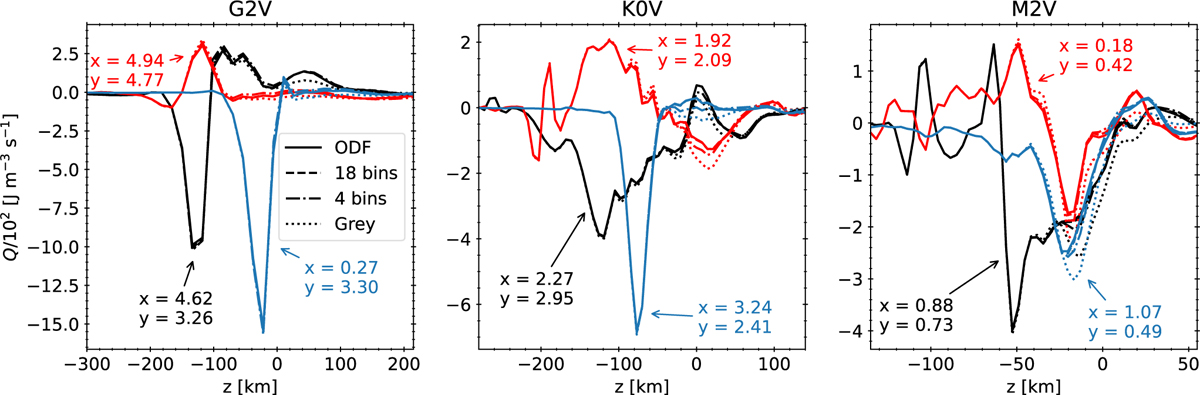
Fig. 15
Download original image
Radiative energy exchange rates in three columns of the last snapshot of the time series of the three stars (different panels). The red curves show an example of Q in the intergranular lanes with large χC; the black curves show an example of Q in the intergranular lanes with small χC; the blue curves show an example of Q in the granules with large χH. Solid lines correspond to the ODF; dashed, to 18 bins; dashed-dotted, to four bins; and dotted, to grey opacity. The position x, y of the selected columns in the stellar domain are written in Mm.
Current usage metrics show cumulative count of Article Views (full-text article views including HTML views, PDF and ePub downloads, according to the available data) and Abstracts Views on Vision4Press platform.
Data correspond to usage on the plateform after 2015. The current usage metrics is available 48-96 hours after online publication and is updated daily on week days.
Initial download of the metrics may take a while.