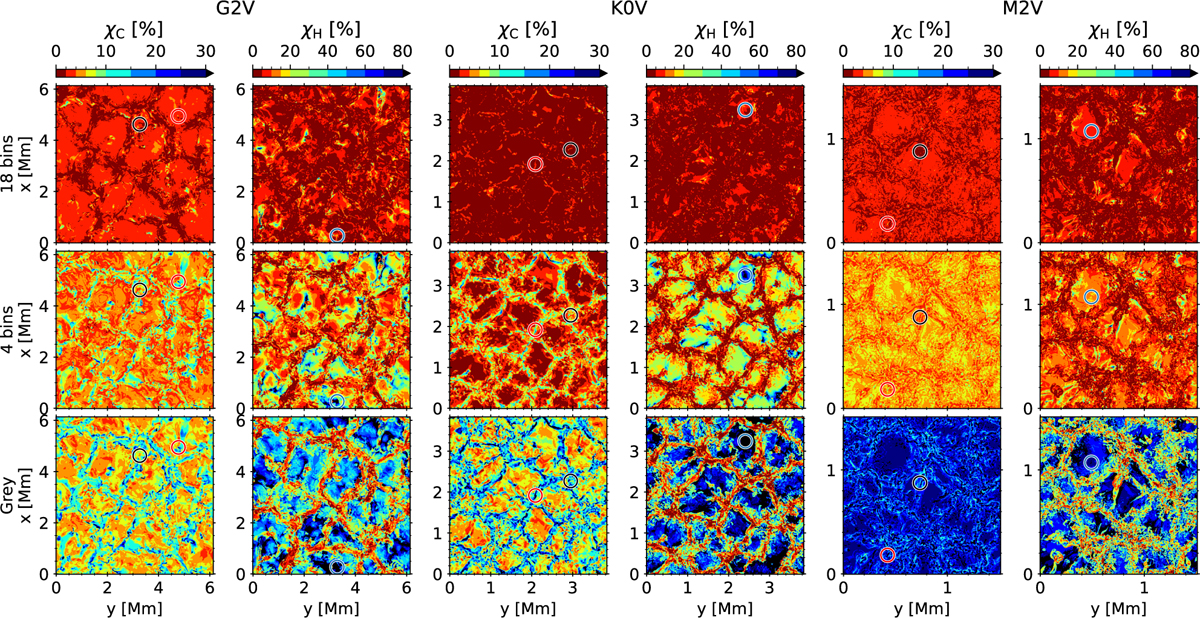
Fig. 14
Download original image
Colour maps of the deviation measures χC (odd columns) and χH (even columns) in the last snapshot of the time series of the G2V (left pair of columns), K0V (middle), and M2V (right) stars. The top row corresponds to the 18OB opacity setup; the middle, to the 4OB; and the bottom, to the grey. The corresponding discrete colour-bar is positioned over each column, ranging between 0–30% and 0–80% for χC and χH, respectively. The black colour in the colour-bar corresponds to χC > 30% and χH > 80%. The division of the colour-scale is non-uniform. The circles mark the positions in the snapshots of the examples shown in Fig. 15 (the colour of the circles matches the colour of their corresponding curves in the figure).
Current usage metrics show cumulative count of Article Views (full-text article views including HTML views, PDF and ePub downloads, according to the available data) and Abstracts Views on Vision4Press platform.
Data correspond to usage on the plateform after 2015. The current usage metrics is available 48-96 hours after online publication and is updated daily on week days.
Initial download of the metrics may take a while.