Fig. 13
Download original image
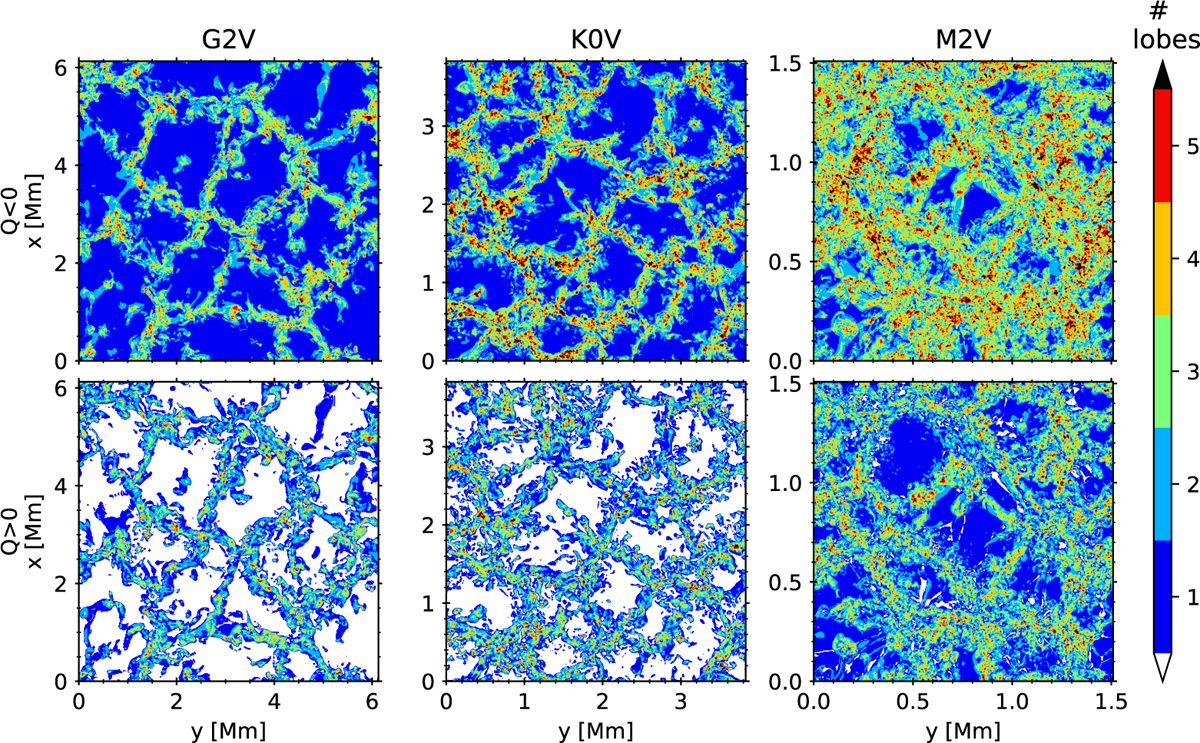
Colour maps of the number of lobes of Q computed with the ODF in the columns of the last snapshot of the time series of the G2V (left column), K0V (middle), and M2V (right) star. The top row shows the number of minima with Q < 0; the bottom row, the number of maxima with Q > 0. Each colour corresponds to a different number of lobes, shown in the colour-bar at the right. The black colour in the colour-bar corresponds to more than five lobes, while white corresponds to zero.
Current usage metrics show cumulative count of Article Views (full-text article views including HTML views, PDF and ePub downloads, according to the available data) and Abstracts Views on Vision4Press platform.
Data correspond to usage on the plateform after 2015. The current usage metrics is available 48-96 hours after online publication and is updated daily on week days.
Initial download of the metrics may take a while.