Fig. 4
Download original image
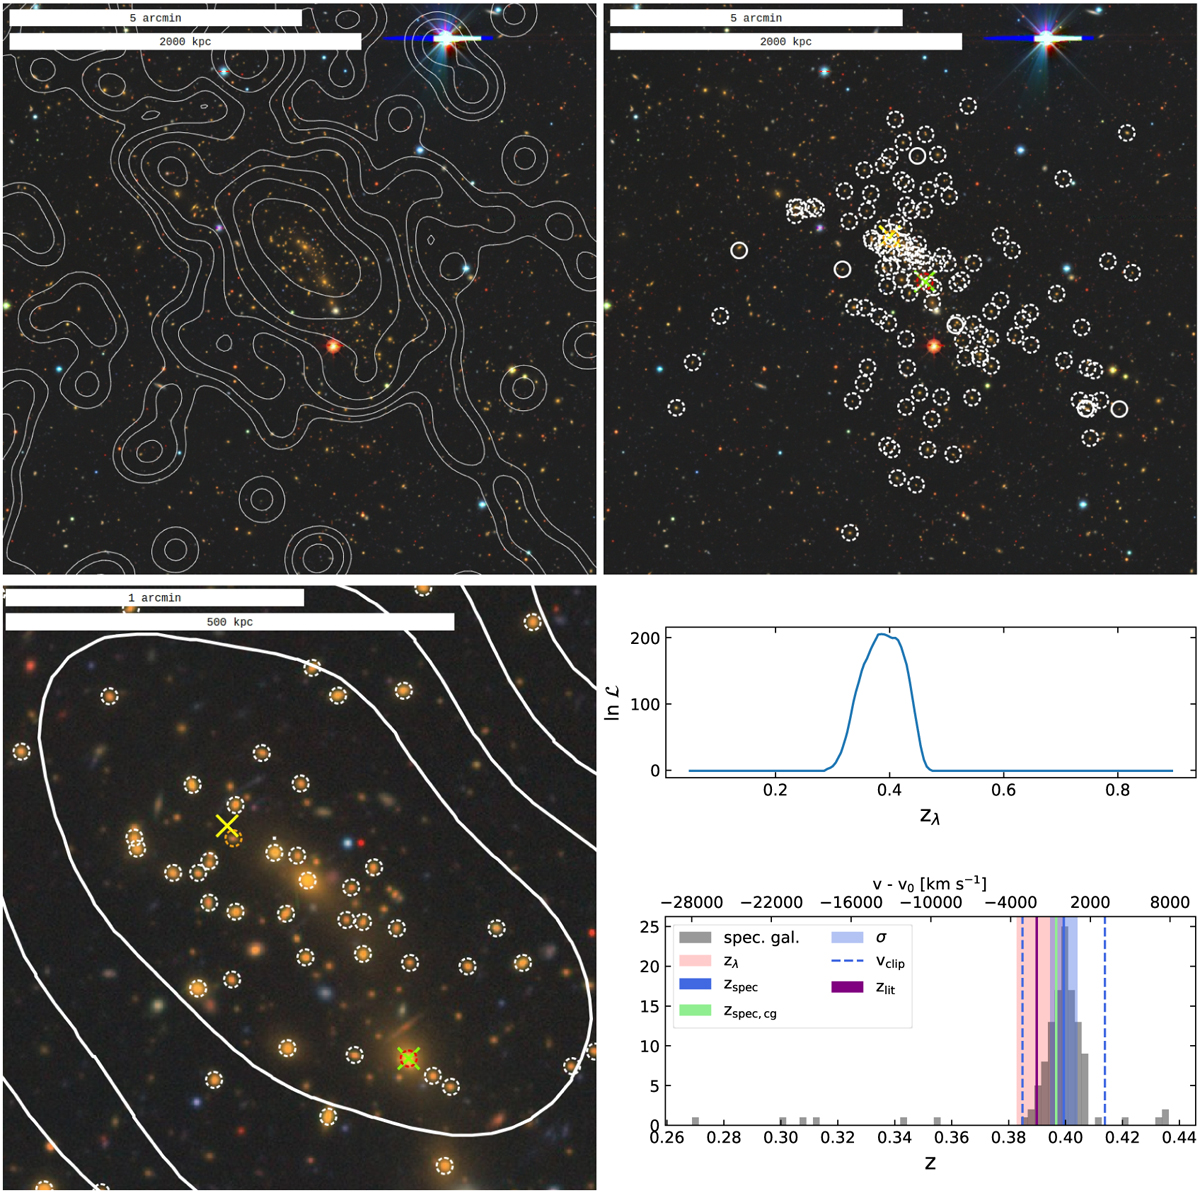
Illustrative example 1eRASS J041610.4-240351 from the eRASS1 cluster catalog. The panels in the top row show an LS grz image of the full cluster overlaid with eRASS1 X-ray contours (left) and cluster members detected in this work (circles, right). Spectroscopic information is available for all cluster members marked by dashed circles. The bottom-left panel shows a zoom-in. The red circle marks the BCG, which agrees with the optical cluster center (green cross). The orange circle is located at the position of the central galaxy, which is the one closest to the X-ray center (yellow cross). North is up; east is left. In the bottom-right panel, upper subpanel, the cluster likelihood ln ![]() (z) shows one peak at z = 0.385 which is close to the cluster photometric redshift zλ, = 0.3910 ± 0.0082. The bottom-right panel, lower subpanel, demonstrates the measurements of the spectroscopic redshift and the velocity dispersion for the shown cluster. The cluster has a richness of λ = 128.7 ± 8.5. The 127 photometric members are marked by circles. Of those, 121 have spectroscopic redshifts and are marked by dashed circles. The black histogram in the bottom panel shows the spectroscopic redshifts of the photometric members. Ten outlier galaxies with z ≶ zspec ± 3σ (blue dashed lines) are discarded, leaving Nmembers = 111 spectroscopic members. The cluster velocity dispersion is σ = 1034 ± 67 km s−1 (light blue line). The photometric cluster redshift (light red shades) agrees with the spectroscopic cluster redshift zspec = 0.39936 ± 0.00039 (darker blue line). The redshift of the galaxy at the optical center is zspec,cg = 0.3967 ± 0.0004 (green line). The literature redshift zlit = 0.38989 (purple line) is a photometric redshift from MARDY3 (Klein et al. 2019).
(z) shows one peak at z = 0.385 which is close to the cluster photometric redshift zλ, = 0.3910 ± 0.0082. The bottom-right panel, lower subpanel, demonstrates the measurements of the spectroscopic redshift and the velocity dispersion for the shown cluster. The cluster has a richness of λ = 128.7 ± 8.5. The 127 photometric members are marked by circles. Of those, 121 have spectroscopic redshifts and are marked by dashed circles. The black histogram in the bottom panel shows the spectroscopic redshifts of the photometric members. Ten outlier galaxies with z ≶ zspec ± 3σ (blue dashed lines) are discarded, leaving Nmembers = 111 spectroscopic members. The cluster velocity dispersion is σ = 1034 ± 67 km s−1 (light blue line). The photometric cluster redshift (light red shades) agrees with the spectroscopic cluster redshift zspec = 0.39936 ± 0.00039 (darker blue line). The redshift of the galaxy at the optical center is zspec,cg = 0.3967 ± 0.0004 (green line). The literature redshift zlit = 0.38989 (purple line) is a photometric redshift from MARDY3 (Klein et al. 2019).
Current usage metrics show cumulative count of Article Views (full-text article views including HTML views, PDF and ePub downloads, according to the available data) and Abstracts Views on Vision4Press platform.
Data correspond to usage on the plateform after 2015. The current usage metrics is available 48-96 hours after online publication and is updated daily on week days.
Initial download of the metrics may take a while.